IATF 16949:2016 Clause 5.1.1.2 Process effectiveness and efficiency

Process effectiveness and efficiency are business terms often used interchangeably or in a general combination. Effectiveness refers to your ability to optimize business strengths in the way you operate. Efficiency refers to your ability to optimize your resources and business activities to generate revenue and profits. Organizations simply cannot ignore the terms ‘efficiency’ and ‘effectiveness’  For increasing productivity as well as improving customer service, both of these are essential. Efficiency is doing things right; effectiveness is doing the right things.

1

Clause 5.1.1.2 Process effectiveness and efficiency

Top management must check the processes for making products and the support processes to see if they work well and are efficient. The findings from these reviews must be considered when top management conducts management review.

Clause 5.1.1.2 requires top management to have a method for reviewing all organizational activities that relate to supplying parts to the organization’s customers.  IATF 6949 adds a requirement that top management must regularly review the effectiveness and efficiency of the product realization and support processes. In simple English, that requires top management to ask how well the core business is being managed. Financial measures obviously come to mind. but from the quality perspective, measures of parts per million (ppm) nonconforming at the customer, first-run capability (the percent of product produced without repair operations). scrap, employee turnover, and delivery performance to the schedule are among the appropriate metrics for measuring core business efficiency. The clause also requires not to ensure that the results of process review activities will now be included in management review. Process review activities need to include evaluation methods and, as a result, implement improvements. The results of these steps would be an input to the management review process. Top management is thus performing a review of the process-specific reviews performed by the process owners.

Top management at each site must review process effectiveness and efficiency . This may include:

  • Achievement of continual improvement objectives for identified product realization and support processes
  • Optimization of the interaction of these processes
  • Verification that these processes operate as an effective and efficient network
  • Monitoring cost trends and benchmarking of key processes

Process Effectiveness

Effectiveness is an external measure of performance and indicates how well a Process fulfills the demands of various stakeholders. Simply put, it is “doing the right things.” For example, in educational institutions, effectiveness is measured by teaching students what they need to know. Managers need to make sure that the services or products meet customers’ expectations. When analyzing a company’s processes, effectiveness takes precedence over efficiency. The effectiveness of a process is the measure of how relevant the output is to the desired objective. A truly effective process will make customers happy by providing everything right. That is the right results at the right place time, and cost. Hence, measure process effectiveness from the customers’ goal point of view.

Effectiveness measures the extent to which planned activities (run rate) and planned results (objectives) are achieved? E.g., say you plan to produce and ship 1000 units a day with zero defects.  At the end of the week, the production records showed we achieved our planned activity of 1000 units per day, but fell short on our planned result, as we incurred a 2.5% defect rate and only hit a 90% on-time delivery rate.

Effectiveness can include discussion of current operations and opportunities for improvement. If your business is currently effective, you are using your core strengths and available resources to best serve the marketplace. A for-profit business with a strong customer service staff is effective if it earns healthy revenue by providing a high level of sales and service production. An effective manufacturing firm uses its buildings, equipment, and workflow to produce quality goods. The activities that make you effective now may not contribute to continued effectiveness. Therefore, it is fair to say that effective companies consistently look for opportunities for growth and development. If an emerging market develops that your company can serve, effectiveness means that you conduct research, recognize the needs and interests of the market, develop products and services to match and promote your brands well to the target customer base. Your company’s effectiveness is somewhat relative to the ability of competitors to produce similar business results with the same resources and opportunities.

Process Efficiency

Efficiency is an internal measure of performance for a process that shows how well the process converts inputs into outputs. The more the ratio of outputs to inputs approaches 100 percent, the better the efficiency of the process will be. In simple terms, it is “doing things right” and comes from the proper harnessing of time, cost, and effort. For example, an employee can improve efficiency by developing a daily work schedule, avoiding personal phone calls, and preventing distractions. Process efficiency, on the other hand, acts as a vital factor in determining productivity. It is a measurable concept. Essentially it is the ratio of ‘useful output to total input’. Hence it requires resource optimization (mainly cost and time) along with maximum waste reduction. To understand process efficiency we need to measure process time, cost, and effort needs.

Efficiency is the relationship between results achieved and resources used. Can we produce more units than planned per hour for the set amount of resources? Or can we use fewer resources than planned to produce the units.? Efficiency can relate to the utilization of any resource – machine, labor, material, facilities, utilities, time, etc.    Let us look at a simple example. Say one operator A can produce 100 good units per hour with 2% material scrap on a machine.  Operator B produces 105 good units with only 1% material scrap per hour on the same machine. Clearly, operator B is more efficient in the use of time as well as material, both of which can be measured. Because there are many other resources to be considered, the measurement of efficiency can get fairly complex and requires a multidisciplinary approach involving production, engineering, cost accounting, and other disciplines.

Efficiency generally refers to how well you convert business investments into revenue and profit. One factor in efficiency is cost control. Efficient companies usually only spend money that produces tangible gains in customers, revenue, or profit. Paying competitive wages while motivating employees to produce the highest goods or sales contributes to efficiency. Paying only for product developments that lead to enhanced customer perception of value is another element of cost control and efficiency.

 Productivity relates the output of goods and services of the company to the inputs of all the resources used in the production of goods and services. In other words, it measures how well a company transforms resources into products. Productivity is the combination of efficiency and effectiveness. This means that a company that only attains efficiency or effectiveness is either partially productive or not productive at all. To be productive, a company needs to be efficient and effective at the same time. Relating efficiency and effectiveness overcomes the shortcomings of using either of them alone. If managers focus on efficiency alone, they may jeopardize the competitiveness of their company. For example, mere focus on efficiency ignores the contribution of the activity to customer value creation. Likewise, the exclusive emphasis on effectiveness ignores the cost-effectiveness of the activity. Improving productivity boosts competitiveness by lowering operational costs, using resources better, increasing market share, and increasing profits.

Measuring Process effectiveness and efficiency 

The starting point involves detailed process mapping and creating the block diagram for the said process after discussing in detail with the operations teams and floor walk-through. The block diagram is then fine-tuned to mark the boundaries thus freezing the beginning point and the ending point of the chosen process. Further planning involves marking the source of inputs that go into the said process, identifying the input source as well as the output customers at intermediate and final stages of the process. Detailed examination of the data that is received as input, the data or deliverable that is required to be sent as output from the process would have to be done to ensure every possible detail is captured. At this point, it becomes necessary to examine the input and output data accuracy, errors, frequency, and standardization of the data as well as to record the customer expectations from the process. Once the entire process mapping and overview has been completed and defined, the next logical step would be to tabulate the measurements and targets for the overall process.

  1. Process Effectiveness Measurement
    Effectiveness of a process refers to the usefulness of the process output in relation to the expectations and needs of the Customer. The effectiveness of the process lies in being able to provide the desired output as needed by the Customer at the right time, the right way, and at the right place, and more importantly at the right cost too. The process of setting up process effectiveness measurement begins with outlining the complete Customer expectations and needs detail. These expectations would then be converted into measurable targets and expectations. Lastly, the data collection and measurement methods would need to be outlined. It helps to elaborate a little more on the process effectiveness measurement and the attributes that are used as measurements. In most cases, it is generally seen that the customer expectations and requirements are not defined clearly with specifications in terms of the delivery format, frequency, and so on. In addition, the customer’s expectation of error-free service, customer experience, and quality of service is not defined or understood well enough and is not quantified. Now is the time to examine the customer expectations in detail and establish the criteria for delivery of the said product or service in line with customer expectations. There are several criteria that are used to measure the process effectiveness specifically in relation to the Customer expectations. Some of the popular and useful criteria used in the product as well as service industry include – Product or Service Presentation, Timeliness of Delivery, Accuracy of Service, Reliability of Service or Product, Product usability, Product serviceability, and Customer Service, Responsiveness, etc. Once the criteria for measurement have been established and accepted, the next sequential step would be to formalize the measurement criteria and freeze the formats. Measurement criteria here would include the usage of QC Inspection, Check Sheets, AQ Sampling formats to be used at the Customer end, Customer Inspection and Installation reports or feedback forms, etc. Specific measurement criteria can be set up depending upon the specific business case.
  2. Process Efficiency
    Efficient execution of the process is very important for very many reasons. In most cases, the processes are normally found to contain inefficiencies built over a period of time. First and foremost every customer who is buying a product or a Service expects efficiency of service. Depending upon the nature of the business or the service, the process efficiency can be ascertained. The efficiency of service in a restaurant can be measured in terms of time taken from Order to Delivery of Food and in the case of an Airline; the check-in process efficiency could be of prime importance to gauge service efficiency. Take the case of Sales Order processing; the process efficiency would be of importance when it comes to the calculation of total time taken from the Order to delivery to the end customer. Process efficiency is not only important from the point of view of the external customers alone. Internally too, process efficiency has a bearing on the cost of the operations as well. Internally the process efficiency can be measured using several criteria including but not limited to – Total processing time, Resource utilization per unit of output, Non-Value Added Cost, Non-Value Added Time, Cost of Quality, etc. Measuring the processing time at all stages throws up a lot of factors that are aiding or harming the process efficiency and thus provides ample information to be able to work on process control and improvement. Measurement of process time or cycle time will also throw up non-value-added time as well as activity that can be acted upon for correction. Furthermore, any deficiency in the training or skills of the workers and any delay or inefficiency from the related processes that are supposed to provide the inputs will also show up with the measurement of the cycle time of the process. The efficiency of the process has a direct bearing on the Customer’s expectation and the promise to the Customer as well as to the overall operational cost. Therefore putting process efficiency measurements in place will help bring out the areas and factors that are needed to be controlled, managed, changed, and altered in the process of improving the said process.

Some metrics used for calculating Process efficiency and effectiveness are

Improving Customer Experience & Responsiveness

On-Time Delivery to Commit – This metric is the percentage of time that manufacturing delivers a completed product on the schedule that was committed to customers.

Manufacturing Cycle Time –  Measures the speed or time it takes for manufacturing to produce a given product from the time the order is released to production, to finished goods.

Time to Make Changeovers – Measures the speed or time it takes to switch a manufacturing line or plant from making one product over to making a different product.

Improving Quality

Yield – Indicates a percentage of products that are manufactured correctly and to specifications the first time through the manufacturing process without scrap or rework.

Customer Rejects/ Return Material Authorizations/ Returns – A measure of how many times customers reject products or request returns of products based on receipt of a bad or out of specification product.

Supplier’s Quality Incoming – A measure of the percentage of good quality materials coming into the manufacturing process from a given supplier.

Improving Efficiency

Throughput – Measures how much product is being produced on a machine, line, unit, or plant over a specified period of time.

Capacity Utilization – Indicates how much of the total manufacturing output capacity is being utilized at a given point in time.

Overall Equipment Effectiveness (OEE) – This multi-dimensional metric is a multiplier of Availability x Performance x Quality, and it can be used to indicate the overall effectiveness of a piece of production equipment or an entire production line.

Schedule or Production Attainment – A measure of what percentage of time a target level of production is attained within a specified schedule of time.

Reducing Inventory

WIP Inventory/Turns – A commonly used ratio calculation to measure the efficient use of inventory materials. It is calculated by dividing the cost of goods sold by the average inventory used to produce those goods.

Ensuring Compliance

Reportable Health and Safety Incidents – A measure of the number of health and safety incidents that were either actual incidents or near misses that were recorded as occurring over a period of time.

Reportable Environmental Incidents – A measure of the number of health and safety incidents that were recorded as occurring over a period of time.

Number of Non-Compliance Events / Year – A measure of the number of times a plant or facility operated outside the guidelines of normal regulatory compliance rules over a one-year period. These non-compliances need to be fully documented as to the specific non-compliance time, reasons, and resolutions.

Reducing Maintenance

Percentage Planned vs. Emergency Maintenance Work Orders – This ratio metric is an indicator of how often scheduled maintenance takes place, versus more disruptive/un-planned maintenance.

Downtime in Proportion to Operating Time – This ratio of downtime to operating time is a direct indicator of asset availability for production.

Increasing Flexibility & Innovation

Rate of New Product Introduction –  Indicates how rapidly new products can be introduced to the marketplace and typically includes a combination of design, development, and manufacturing ramp-up times.

Engineering Change Order Cycle Time – A measure of how rapidly design changes or modifications to existing products can be implemented all the way through documentation processes and volume production.

Reducing Costs & Increasing Profitability

Total Manufacturing Cost per Unit Excluding Materials – This is a measure of all potentially controllable manufacturing costs that go into the production of a given manufactured unit, item, or volume.

Manufacturing Cost as a Percentage of Revenue – A ratio of total manufacturing costs to the overall revenues produced by a manufacturing plant or business unit.

Net Operating Profit – Measures the financial profitability for all investors/shareholders/debt holders, either before or after taxes, for a manufacturing plant or business unit.

Productivity in Revenue per Employee – This is a measure of how much revenue is generated by a plant, business unit, or company, divided by the number of employees.

Average Unit Contribution Margin – This metric is calculated as a ratio of the profit margin that is generated by a manufacturing plant or business unit, divided into a given unit or volume of production.

Return on Assets/Return on Net Assets – A measure of financial performance calculated by dividing the net income from a manufacturing plant or business unit by the value of fixed assets and working capital deployed.

Energy Cost per Unit – A measure of the cost of energy (electricity, steam, oil, gas, etc.) required to produce a specific unit or volume of production.

 Cash-to-Cash Cycle Time – This metric is the duration between the purchase of a manufacturing plant or business unit’s inventory, and the collection of payments/accounts receivable for the sale of products that utilize that inventory – typically measured in days.

EBITDA – This metric acronym stands for Earnings Before Interest, Taxes, Depreciation, and Amortization. It is a calculation of a business unit or company’s earnings, prior to having any interest payments, tax, depreciation, and amortization subtracted for any final accounting of income and expenses. EBITDA is typically used as a top-level indication of the current operational profitability of a business.

Customer Fill Rate/On-Time delivery/Perfect Order Percentage – This metric is the percentage of times that customers receive the entirety of their ordered manufactured goods, to the correct specifications, and delivered at the expected time.

IATF 16949:2016 Clause 5.1.1.1 Corporate responsibility

It’s been over a year since Volkswagen was caught cheating on EPA tests, but the effects of that scandal are still reverberating throughout the automotive industry. The IATF 16949 standard has been revised by the International Automotive Task Force (IATF) based on industry feedback and engagement. This is the first time that ethics language has been included in an automotive quality standard. It’s significant because it gives us an opportunity to verify where the supply base stands on several core ethics policies. The new IATF 16949 standard states that certified organizations must implement basic corporate responsibility policies, such as anti-bribery policies, an employee code of conduct, and an ethics escalation (whistle-blower) policy. Nine North American and European OEMs and five national automotive supplier associations have agreed to include corporate responsibility requirements in the new quality standard. The language is basic, but it clearly requires automotive sites worldwide to provide documentation that they have established an employee behavioral expectation code, implemented a formal process to report code violations, and published an anti-bribery policy. There are no incremental costs to suppliers or OEMs to capture this corporate responsibility data. By late 2018, more than 65,000 supplier sites that are certified to the new standard—primarily Tier One and Tier Two direct-part manufacturers—must be physically audited and re-certified by an approved IATF third-party certification body. Non-compliance could result in the suspension of a supplier’s quality certification and limitations to accessing new business opportunities. Fortunately, the Automotive Industry Action Group (AIAG), which oversees the creation of these global standards, is offering a free knowledge assessment tool so that industry professionals can identify gaps in their understanding of the Group’s Global Guidance Principles and address them before being audited.

IATF 16949:2016  5.1.1.1 Corporate responsibility

The organization needs to make and follow rules about being responsible. This includes having policies to stop bribery, guidelines for how employees should behave, and a way for people to report problems, like a whistle-blowing policy.

Explanation:

To be successful today, the automotive industry and its supply chain partners must contend with heightened expectations from a range of stakeholders on complex corporate responsibility issues:
• A plethora of governmental regulations affect the use and management of chemicals in the production process. The organization must keep abreast of existing and emerging regulations on the use and management of chemicals in the production process and provide an assessment of their impact.
• A growing number of regions, countries, and non-governmental organizations throughout the world require companies to report greenhouse gas emissions, which also factor into financial firms’ assessments, stockholder decisions, and customer perceptions. This is an important first step in environmental sustainability. OEMs and suppliers are required to calculate and report emissions from the supply base in a consistent and accurate manner and creating cost savings for the organization. The lessons learned and processes implemented for GHGs will set a foundation for other elements of environmental sustainability (i.e., water, wastes).
• The increased globalization of automotive production makes understanding and managing the impact of working conditions on business a greater challenge. Understanding and managing the impacts of the working conditions of business has become a greater challenge with the increased globalization of automotive production, and developing responsible working conditions begins with having a shared understanding of the key issues(child labor, forced labor, freedom of association, harassment and discrimination, health and safety, wages and benefits, and working hours.) up and down the supply chain.

  1. Business Ethics
    The basis for sustainable and successful business activity is to have integrity and transparent business practices. Companies are expected to operate honestly and equitably throughout the supply chain in accordance with local law, including those laws pertaining to:
    • Anti-Corruption
    • Anti-competitive Business Practices
    • Protection of Intellectual Property
    • Respect for Company and Personal Data
    • Export Controls
    • Conflicts of Interest
  2. Environmental Standards
    Companies are expected to pursue effective environmental protection throughout the supply chain in order to reduce the environmental footprint of our products throughout their life-cycle. All products manufactured within the supply chain and the applied materials and substances used in the process are expected to meet environmental standards for design, development, distribution, use, disposal, or recycling. Such a comprehensive approach includes but is not limited to:
    • Reducing energy and water consumption
    • Reducing greenhouse gas emissions
    • Increasing use of renewable energies
    • Enhancing appropriate waste management
    • Training of employees
    Businesses are expected to support a proactive approach to environmental challenges and encourage the development and diffusion of environmentally friendly technologies.
  3. Working Conditions and Human Rights
    1. Child Labor and Young Workers
      Child labor should not be tolerated and the age of employment must be in accordance with local labor law.
    2. Wages and Benefits
      Compensation and benefits should be competitive and comply with applicable local laws, including those relating to minimum wages, overtime compensation, and legally mandated benefits.
    3. Working Hours
      Working hours, including overtime, should comply with applicable local laws regulating hours of work.
    4. Forced Labor
      Any form of forced or compulsory labor, including human trafficking, should not be tolerated.
    5. Freedom of Association
      Workers should be able to communicate openly with management regarding working conditions without fear of reprisal, intimidation, or harassment. Workers should have the right to associate freely, to join or not join labor unions, seek representation, and join workers’ councils in accordance with local laws.
    6. Health and Safety
      Workers should have a safe and healthy working environment that meets or exceeds applicable standards for safety and occupational health.
    7. Harassment and Discrimination
      Harassment or discrimination against employees in any form is not acceptable.

Anti Bribery Policy

Ethical business practices are not only necessary for preserving reputability and improving business overall, but also for adhering to the law. Conducting bribery or corrupt activities won’t just get you a slap on the wrist; you could be heavily fined or potentially put behind bars. Bribery includes the act of offering, giving, promising, asking, agreeing, receiving, or soliciting something of value for the purpose of influencing action. But being involved in bribery is not just limited to the act of offering a bribe: if you are on the receiving end and accept it, you are also breaking the law.  Anti Bribery  Policies should aim to:

  • Demonstrate its understanding of anti-bribery law.
  • Emphasise that the company has zero-tolerance for bribery.
  • Detail whom the policy applies to.
  • Detail the company and employees’ responsibilities.
  • Reduce and control bribery risks.
  • Provide rules about accepting gifts.
  • Provide guidance on how business should be conducted so to prevent bribery.
  • Provide direction on how to avoid conflicts of interest.
  • Include information about monitoring and reviewing the policy.
  • An anti-bribery policy demonstrates a company’s commitment to preventing bribery and corrupt activities, and all staff should be instructed to familiarise themselves with the information it contains.

Having this policy in place ensures that everyone knows what to do in regards to preventing bribery, which minimizes the risks of bribery and corruption occurring in your business and therefore protects your company from facing any issues with the law.

Six Principles to prevent Bribery in the organization

The Organization having Anti- Bribery policy in place and wishing to prevent bribery from being committed on their behalf should follow the following Six principles.  Commentary and guidance on what procedures the application of the principles may produce accompany each principle. These principles are not prescriptive. They are intended to be flexible and outcome focussed, allowing for the huge variety of circumstances that organizations find themselves in. Small organizations will, for example, face different challenges to those faced by large multi-national enterprises. Accordingly, the detail of how organizations might apply these principles, taken as a whole, will vary, but the outcome should always be robust and effective anti-bribery procedures. To set out in more detail below, bribery prevention procedures should be proportionate to risk.

Principle 1: Proportionate procedures

An Organisation’s procedures to prevent bribery by persons associated with it are proportionate to the bribery risks it faces and to the nature, scale, and complexity of the organization’s activities. They are also clear, practical, accessible, effectively implemented, and enforced.
Commentary
The term ‘procedures’ is used to embrace both bribery prevention policies and the procedures which implement them. Policies articulate the organization’s anti-bribery stance, show how it will be maintained, and help to create an anti-bribery culture. They are therefore a necessary measure in the prevention of bribery, but they will not achieve that objective unless they are properly implemented. Adequate bribery prevention procedures ought to be proportionate to the bribery risks that the organization faces. An initial assessment of risk across the organization is therefore a necessary first step. To a certain extent, the level of risk will be linked to the size of the organization and the nature and complexity of its business, but size will not be the only determining factor. Some small organizations can face quite significant risks and will need more extensive procedures than their counterparts facing limited risks. However, small organizations are unlikely to need procedures that are as extensive as those of a large multi-national organization. For example, a very small business may be able to rely heavily on periodic oral briefings to communicate its policies while a large one may need to rely on extensive written communication. The level of risk that organizations face will also vary with the type and nature of the persons associated with it. For example, an organization that properly assesses that there is no risk of bribery on the part of one of its associated persons will accordingly require nothing in the way of procedures to prevent bribery in the context of that relationship. By the same token, the bribery risks associated with reliance on a third party agent representing a commercial organization in negotiations with foreign public officials may be assessed as significant and accordingly require much more in the way of procedures to mitigate those risks. Organizations are likely to need to select procedures to cover a broad range of risks but any consideration by a court in an individual case of the adequacy of procedures is likely necessary to focus on those procedures designed to prevent bribery on the part of the associated person committing the offence in question. Bribery prevention procedures may be stand-alone or form part of wider guidance, for example on recruitment or on managing a tender process in public procurement. Whatever the chosen model, the procedures should seek to ensure there is a practical and realistic means of achieving the organization’s stated anti-bribery policy objectives across all of the organization’s functions. Applying these procedures retrospectively to existing associated persons is more difficult, but this should be done over time, adopting a risk-based approach and with due allowance for what is practicable and the level of control over existing arrangements.

Procedures
Organizations’ bribery prevention policies are likely to include certain common elements. As an indicative and not exhaustive list, an organization may wish to cover in its policies

  • its commitment to bribery prevention
  • its general approach to mitigation of specific bribery risks, such as those arising from the conduct of intermediaries and agents, or those associated with hospitality and promotional expenditure, facilitation payments, or political and charitable donations or contributions;
  • an overview of its strategy to implement its bribery prevention policies.

The procedures put in place to implement an organization’s bribery prevention policies should be designed to mitigate identified risks as well as to prevent deliberate unethical conduct on the part of associated persons. The following is an indicative and not exhaustive list of the topics that bribery prevention procedures might embrace depending on the particular risks faced:

  • The involvement of the organization’s top-level management.
  • Risk assessment procedures
  •  Due diligence of existing or prospective associated persons
  • The provision of gifts, hospitality, and promotional expenditure; charitable and political donations; or demands for facilitation payments.
  • Direct and indirect employment, including recruitment, terms, and conditions, disciplinary action, and remuneration.
  • Governance of business relationships with all other associated persons including pre and post-contractual agreements
  • Financial and commercial controls such as adequate bookkeeping, auditing, and approval of expenditure
  • Transparency of transactions and disclosure of information.
  • Decision makings, such as delegation of authority procedures, separation of functions, and the avoidance of conflicts of interest
  • Enforcement, detailing discipline processes and sanctions for breaches of the organization’s anti-bribery rules.
  • The reporting of bribery including ‘speak up’ or ‘whistle blowing’ procedures
  • The detail of the process by which the organization plans to implement its bribery prevention procedures, for example, how its policy will be applied to individual projects and to different parts of the organization.
  • The communication of the organization’s policies and procedures, and training in their application
  • The monitoring, review, and evaluation of bribery prevention procedures

Principle 2: Top-level commitment

The top-level management (be it a board of directors, the owners, or any other equivalent body or person) are committed to preventing bribery by persons associated with it. They foster a culture within the organization in which bribery is never acceptable.

Commentary
Those at the top of an organization are in the best position to foster a culture of integrity where bribery is unacceptable. The purpose of this principle is to encourage the involvement of top-level management in the determination of bribery prevention procedures. It is also to encourage top-level involvement in any key decision-making relating to bribery risk where that is appropriate for the organization’s management structure.
Procedures
Whatever the size, structure, or market of a commercial organization, top-level management commitment to bribery prevention is likely to include (1) communication of the organization’s anti-bribery stance, and (2) an appropriate degree of involvement in developing bribery prevention procedures.

Internal and external communication of the commitment to zero tolerance to bribery. This could take a variety of forms. A formal statement appropriately communicated can be very effective in establishing an anti-bribery culture within an organization. Communication might be tailored to different audiences. The statement would probably need to be drawn to people’s attention on a periodic basis and could be generally available, for example on an organization’s intranet and/or internet site. Effective formal statements that demonstrate top-level commitment are likely to include:

  • a commitment to carry out business fairly, honestly, and openly
  • a commitment to zero tolerance towards bribery• the consequences of breaching the policy for employees and managers
  • for other associated persons the consequences of breaching contractual provisions relating to bribery prevention (this could include a reference to avoiding doing business with others who do not commit to doing business without bribery as a ‘best practice’ objective
  • articulation of the business benefits of rejecting bribery (reputational, customer, and business partner confidence)
  • reference to the range of bribery prevention procedures the commercial organization has or is putting in place, including any protection and procedures for confidential reporting of bribery (whistle-blowing)
  • key individuals and departments involved in the development and implementation of the organization’s bribery prevention procedures
  • reference to the organization’s involvement in any collective action against bribery in, for example, the same business sector.

Top-level involvement in bribery prevention
Effective leadership in bribery prevention will take a variety of forms appropriate for and proportionate to the organization’s size, management structure, and circumstances. In smaller organizations, a proportionate response may require top-level managers to be personally involved in initiating, developing, and implementing bribery prevention procedures and bribery critical decision making. In a large multi-national organization the board should be responsible for setting bribery prevention policies, tasking management to design, operate, and monitor bribery prevention procedures, and keeping these policies and procedures under regular review. But whatever the appropriate model, top-level engagement is likely to reflect the following elements:

  • Selection and training of senior managers to lead anti-bribery work where appropriate.
  • Leadership on key measures such as a code of conduct.
  • Endorsement of all bribery prevention-related publications.
  • Leadership in awareness-raising and encouraging transparent dialogue throughout the organization so as to seek to ensure effective dissemination of anti-bribery policies and procedures to employees, subsidiaries, and associated persons, etc.
  • Engagement with relevant associated persons and external bodies, such as sectoral organizations and the media, to help articulate the organization’s policies.
  • Specific involvement in high profile and critical decision making where appropriate
  • Assurance of risk assessment.
  • General oversight of breaches of procedures and the provision of feedback to the board or equivalent, where appropriate, on levels of compliance.

Principle 3: Risk Assessment

The commercial organization assesses the nature and extent of its exposure to potential external and internal risks of bribery on its behalf by persons associated with it. The assessment is periodic, informed, and documented.

Commentary

For organizations, this principle will manifest itself as part of a general risk assessment carried out in clause 4 in relation to business objectives.  The purpose of this principle is to promote the adoption of risk assessment procedures that are proportionate to the organization’s size and structure and to the nature, scale, and location of its activities. But whatever approach has adopted the fuller the understanding of the bribery risks an organization faces the more effective its efforts to prevent bribery are likely to be. Some aspects of risk assessment involve procedures that fall within the generally accepted meaning of the term ‘due diligence.

Procedures

Risk assessment procedures that enable the organization accurately to identify and prioritize the risks it faces will, whatever its size, activities, customers, or markets, usually reflect a few basic characteristics. These are

  • Oversight of the risk assessment by top-level management.
  • Appropriate resourcing – this should reflect the scale of the organization’s business and the need to identify and prioritize all relevant risks
  • Identification of the internal and external information sources that will enable risk to be assessed and reviewed.
  • Due diligence inquiries
  • Accurate and appropriate documentation of the risk assessment and its conclusions.

As a commercial organization’s business evolves, so will the bribery risks it faces and hence so should its risk assessment. For example, the risk assessment that applies to an organization’s domestic operations might not apply when it enters a new market in a part of the world in which it has not done business before

Commonly encountered risks

Commonly encountered external risks can be categorized into five broad groups – country, sectoral, transaction, business opportunity, and business partnership:

  1. Country risk: this is evidenced by perceived high levels of corruption, an absence of effectively implemented anti-bribery legislation, and a failure of the foreign government, media, local business community, and civil society effectively to promote transparent procurement and investment policies.
  2. Sectoral risk: some sectors are at higher risk than others. Higher-risk sectors include the extractive industries and the large-scale infrastructure sector.
  3. Transaction risk: certain types of transactions give rise to higher risks, for example, charitable or political contributions, licenses and permits, and transactions relating to public procurement.
  4.  Business opportunity risk: such risks might arise in high-value projects or with projects involving many contractors or intermediaries; or with projects which are not apparently undertaken at market prices, or which do not have a clear legitimate objective.
  5. Business partnership risk: certain relationships may involve higher risk, for example, the use of intermediaries in transactions with foreign public officials; consortia or joint venture partners; and relationships with politically exposed persons where the proposed business relationship involves, or is linked to, a prominent public official.

 An assessment of external bribery risks is intended to help decide how those risks can be mitigated by procedures governing the relevant operations or business relationships, but a bribery risk assessment should also examine the extent to which internal structures or procedures may themselves add to the level of risk. Commonly encountered internal factors may include

  • deficiencies in employee training, skills, and knowledge
  • bonus culture that rewards excessive risk-taking
  •  lack of clarity in the organization’s policies on, and procedures for, hospitality and promotional expenditure, and political or charitable contributions
  • lack of clear financial controls
  • lack of a clear anti-bribery message from the top-level management.

Principle 4: Due diligence

The organization applies due diligence procedures, taking a proportionate and risk-based approach, in respect of persons who perform or will perform services for or on behalf of the organization, in order to mitigate identified bribery risks.

Commentary

Due diligence is firmly established as an element of corporate good governance and it is envisaged that due diligence related to bribery prevention will often form part of a wider due diligence framework. Due diligence procedures are both a form of bribery risk assessment and a means of mitigating risk. By way of illustration, an organization may identify risks that as a general proposition attach to doing business in reliance upon local third-party intermediaries. Due diligence of specific prospective third-party intermediaries could significantly mitigate these risks. The significance of the role of due diligence in bribery risk mitigation justifies its inclusion here as a Principle in its own right. The purpose of this Principle is to encourage organizations to put in place due diligence procedures that adequately inform the application of proportionate measures designed to prevent persons associated with them from bribing on their behalf.

Procedures

As this guidance emphasizes throughout, due diligence procedures should be proportionate to the identified risk. They can also be undertaken internally or by external consultants. A person ‘associated with an organization includes any person performing services for a commercial organization. The scope of this definition is broad and can embrace a wide range of business relationships. But the appropriate level of due diligence to prevent bribery will vary enormously depending on the risks arising from the particular relationship. So, for example, the appropriate level of due diligence required by an organization when contracting for the performance of information technology services may be low, to reflect low risks of bribery on its behalf. In contrast, an organization that is selecting an intermediary to assist in establishing a business in foreign markets will typically require a much higher level of due diligence to mitigate the risks of bribery on its behalf. Organizations will need to take considerable care in entering into certain business relationships, due to the particular circumstances in which the relationships come into existence. An example is where local law or convention dictates the use of local agents in circumstances where it may be difficult for an organization to extricate itself from a business relationship once established. The importance of thorough due diligence and risk mitigation prior to any commitment is paramount in such circumstances. Another relationship that carries particularly important due diligence implications is a merger of organizations or an acquisition of one by another. ‘Due diligence’  should be conducted using a risk-based approach. For example, in lower-risk situations, organizations may decide that there is no need to conduct much in the way of due diligence. In higher-risk situations, due diligence may include conducting direct interrogative inquiries, indirect investigations, or general research on proposed associated persons. Appraisal and continued monitoring of recruited or engaged ‘associated’ persons may also be required, proportionate to the identified risks. Generally, more information is likely to be required from prospective and existing associated persons that are incorporated (e.g. companies) than from individuals. This is because on a basic level more individuals are likely to be involved in the performance of services by a company and the exact nature of the roles of such individuals or other connected bodies may not be immediately obvious. Accordingly, due diligence may involve direct requests for details on the background, expertise, and business experience, of relevant individuals. This information can then be verified through research and the following up of references, etc. An organization’s employees are presumed to be persons associated with the organization for the purposes of the Bribery Act. The organization may wish, therefore, to incorporate in its recruitment and human resources procedures an appropriate level of due diligence to mitigate the risks of bribery being undertaken by employees which are proportionate to the risk associated with the post in question. Due diligence is unlikely to be needed in relation to lower-risk posts.

Principle 5: Communication (including training)

The organization seeks to ensure that its bribery prevention policies and procedures are embedded and understood throughout the organization through internal and external communication, including training, that is proportionate to the risks it faces.

Commentary

Communication and training deter bribery by associated persons by enhancing awareness and understanding of a commercial organization’s procedures and to the organization’s commitment to their proper application. Making information available assists in more effective monitoring, evaluation, and review of bribery prevention procedures. Training provides the knowledge and skills needed to employ the organization’s procedures and deal with any bribery-related problems or issues that may arise.

Procedures for Communication

  1. The content, language, and tone of communications for internal consumption may vary from that for external use in response to the different relationship the audience has with the commercial organization. The nature of communication will vary enormously between commercial organizations in accordance with the different bribery risks faced, the size of the organization, and the scale and nature of its activities.
  2. Internal communications should convey the ‘tone from the top’ but are also likely to focus on the implementation of the organization’s policies and procedures and the implications for employees. Such communication includes policies on particular areas such as decision making, financial control, hospitality, and promotional expenditure, facilitation payments, training, charitable and political donations and penalties for breach of rules, and the articulation of management roles at different levels. Another important aspect of internal communications is the establishment of a secure, confidential, and accessible means for internal or external parties to raise concerns about bribery on the part of associated persons, to provide suggestions for improvement of bribery prevention procedures and controls, and for requesting advice. These so-called ‘speak up’ procedures can amount to a very helpful management tool for commercial organizations with diverse operations that may be in many countries. If these procedures are to be effective there must be adequate protection for those reporting concerns.
  3.  External communication of bribery prevention policies through a statement or codes of conduct, for example, can reassure existing and prospective associated persons and can act as a deterrent to those intending to bribe on a commercial organization’s behalf. Such communications can include information on bribery prevention procedures and controls, sanctions, results of internal surveys, rules governing recruitment, procurement, and tendering. An organization may consider it proportionate and appropriate to communicate its anti-bribery policies and commitment to them to a wider audience, such as other organizations in its sector and to sectoral organizations that would fall outside the scope of the range of its associated persons, or to the general public.

Procedure for Training

Like all procedures training should be proportionate to risk but some training is likely to be effective in firmly establishing an anti-bribery culture whatever the level of risk. Training may take the form of education and awareness-raising about the threats posed by bribery in general and in the sector or areas in which the organization operates in particular, and the various ways it is being addressed. General training could be mandatory for new employees or for agents (on a weighted risk basis) as part of an induction process, but it should also be tailored to the specific risks associated with specific posts. Consideration should also be given to tailoring training to the special needs of those involved in any ‘speak up’ procedures, and higher risk functions such as purchasing, contracting, distribution and marketing, and working in high-risk countries. Effective training is continuous, and regularly monitored and evaluated. It may be appropriate to require associated persons to undergo training. This will be particularly relevant for high-risk associated persons. In any event, organizations may wish to encourage associated persons to adopt bribery prevention training. Nowadays there are many different training formats available in addition to the traditional classroom or seminar formats, such as e-learning and other web-based tools. But whatever the format, the training ought to achieve its objective of ensuring that those participating in it develop a firm understanding of what the relevant policies and procedures mean in practice for them.

Principle 6: Monitoring and review

The organization monitors and reviews procedures designed to prevent bribery by persons associated with it and makes improvements where necessary.

Commentary

The bribery risks that the organization faces may change over time, as may the nature and scale of its activities, so the procedures required to mitigate those risks are also likely to change. Organizations will therefore wish to consider how to monitor and evaluate the effectiveness of their bribery prevention procedures and adapt them where necessary. In addition to regular monitoring, an organization might want to review its processes in response to other stimuli, for example, governmental changes in countries in which they operate, an incident of bribery, or negative press reports.

Procedures

There is a wide range of internal and external review mechanisms that organizations could consider using. Systems set up to deter, detect and investigate bribery, and monitor the ethical quality of transactions, such as internal financial control mechanisms, will help provide insight into the effectiveness of procedures designed to prevent bribery. Staff surveys, questionnaires, and feedback from training can also provide an important source of information on the effectiveness and a means by which employees and other associated persons can inform the continuing improvement of anti-bribery policies. Organizations could also consider formal periodic reviews and reports for top-level management. Organizations could also draw on information on other organizations’ practices, for example, relevant trade bodies or regulators might highlight examples of good or bad practices in their publications. In addition, organizations might wish to consider seeking some form of external verification or assurance of the effectiveness of anti-bribery procedures. Some organizations may be able to apply for certified compliance with one of the independently-verified anti-bribery standards maintained by industrial sector associations or multilateral bodies. However, such certification may not necessarily mean that a commercial organization’s bribery prevention procedures are ‘adequate’ for all purposes where an offense under section 7 of the Bribery Act could be charged.

Example of Template of Anti Bribery policy

1. What does your policy cover?

1.1 This anti-bribery policy exists to set out the responsibilities o[f [COMPANY Name] and those who work for us in regards to observing and upholding our zero-tolerance position on bribery and corruption.
1.2 It also exists to act as a source of information and guidance for those working for [COMPANY NAME] . It helps them recognise and deal with bribery and corruption issues, as well as understand their responsibilities.

2. Policy statement

2.1 [COMPANY NAME] is committed to conducting business in an ethical and honest manner and is committed to implementing and enforcing systems that ensure bribery is prevented. [COMPANY NAME] has zero-tolerance for bribery and corrupt activities. We are committed to acting professionally, fairly, and with integrity in all business dealings and relationships, wherever in the country we operate.
2.2 [COMPANY NAME] will constantly uphold all laws relating to anti-bribery and corruption in all the jurisdictions in which we operate. We are bound by the laws of India, including the Prevention of Corruption Act 1988, in regards to our conduct both at home and abroad.
2.3 [COMPANY NAME] recognizes that bribery and corruption are punishable by imprisonment and a fine. If our company is discovered to have taken part in corrupt activities, we may be subjected to a fine, be excluded from tendering for public contracts, and face serious damage to our reputation. It is with this in mind that we commit to preventing bribery and corruption in our business and take our legal responsibilities seriously.

3. Who is covered by the policy?

3.1 This anti-bribery policy applies to all employees (whether temporary, fixed-term, or permanent), consultants, contractors, trainees, seconded staff, home workers, casual workers, agency staff, volunteers, interns, agents, sponsors, or any other person or persons associated with us (including third parties), or any of our subsidiaries or their employees, no matter where they are located (within or outside of India). The policy also applies to Officers, Trustees, Board, and/or Committee members at any level.
3.2 In the context of this policy, third-party refers to any individual or organization our company meets and works with. It refers to actual and potential clients, customers, suppliers, distributors, business contacts, agents, advisers, and government and public bodies – this includes their advisors, representatives and officials, politicians, and public parties.
3.3 Any arrangements our company makes with a third party are subject to clear contractual terms, including specific provisions that require the third party to comply with minimum standards and procedures relating to anti-bribery and corruption.

4. Definition of bribery

4.1 Bribery refers to the act of offering, giving, promising, asking, agreeing, receiving, accepting, or soliciting something of value or of an advantage so as to induce or influence an action or decision.
4.2 A bribe refers to any inducement, reward, or object/item of value offered to another individual in order to gain commercial, contractual, regulatory, or personal advantage.
4.3 Bribery is not limited to the act of offering a bribe. If an individual is on the receiving end of a bribe and they accept it, they are also breaking the law.
4.4 Bribery is illegal. Employees must not engage in any form of bribery, whether it be directly, passively (as described above), or through a third party (such as an agent or distributor). They must not bribe a foreign public official anywhere in the world. They must not accept bribes to any degree and if they are uncertain about whether something is a bribe or a gift or act of hospitality, they must seek further advice from the company’s compliance manager.

5. What is and what is NOT acceptable

5.1 This section of the policy refers to the following areas:
• Gifts and hospitality.
• Facilitation payments.
• Political contributions.
• Charitable contributions.
5.2 Gifts and hospitality
[COMPANY NAME] accepts normal and appropriate gestures of hospitality and goodwill (whether given to/received from third parties) so long as the giving or receiving of gifts meets the following requirements:
a. It is not made with the intention of influencing the party to whom it is being given, to obtain or reward the retention of a business or a business advantage, or as an explicit or implicit exchange for favors or benefits.
b. It is not made with the suggestion that a return favor is expected.
c. It is in compliance with local law.
d. It is given in the name of the company, not in an individual’s name.
e. It does not include cash or a cash equivalent (e.g. a voucher or gift certificate).
f. It is appropriate for the circumstances (e.g. giving small gifts around Dipawali / Christmas or as a small thank you to a company for helping with a large project upon completion).
g. It is of an appropriate type and value and given at an appropriate time, taking into account the reason for the gift.
h. It is given/received openly, not secretly.
i. It is not selectively given to a key, influential person, clearly with the intention of directly influencing them.
j. It is not above a certain excessive value, as pre-determined by the company’s compliance manager (usually in excess of Rs1000).
k. It is not offered to, or accepted from, a government official or representative or politician or political party, without the prior approval of the company’s compliance manager.
5.3 Where it is inappropriate to decline the offer of a gift (i.e. when meeting with an individual of a certain religion/culture who may take offense), the gift may be accepted so long as it is declared to the compliance manager, who will assess the circumstances.
5.4 [COMPANY NAME] recognizes that the practice of giving and receiving business gifts varies between countries, regions, cultures, and religions, so definitions of what is acceptable and not acceptable will inevitably differ for each.
5.5 As good practice, gifts that are given and received should always be disclosed to the compliance manager. Gifts from suppliers should always be disclosed.
5.6 The intention behind a gift being given/received should always be considered. If there is any uncertainty, the advice of the compliance manager should be sought.
5.7 Facilitation Payments and Kickbacks
[COMPANY NAME] does not accept and will not make any form of facilitation payments of any nature. We recognize that facilitation payments are a form of bribery that involves expediting or facilitating the performance of a public official for a routine governmental action. We recognize that they tend to be made by low-level officials with the intention of securing or speeding up the performance of a certain duty or action.
5.8 [COMPANY NAME] does not allow kickbacks to be made or accepted. We recognize that kickbacks are typically made in exchange for a business favor or advantage.
5.9 [COMPANY NAME] recognizes that, despite our strict policy on facilitation payments and kickbacks, employees may face a situation where avoiding a facilitation payment or kickback may put their/their family’s personal security at risk. Under these circumstances, the following steps must be taken:
a. Keep any amount to the minimum.
b. Ask for a receipt, detailing the amount and reason for the payment.
c. Create a record concerning the payment.
d. Report this incident to your line manager.
5.10 Political Contributions
[COMPANY NAME] will not make donations, whether in cash, kind, or by any other means, to support any political parties or candidates. We recognize this may be perceived as an attempt to gain an improper business advantage.
5.11 Charitable Contributions
[COMPANY NAME] accepts (and indeed encourages) the act of donating to charities – whether through services, knowledge, time, or direct financial contributions (cash or otherwise) – and agrees to disclose all charitable contributions it makes.
5.12 Employees must be careful to ensure that charitable contributions are not used to facilitate and conceal acts of bribery.
5.13 We will ensure that all charitable donations made are legal and ethical under local laws and practices and that donations are not offered/made without the approval of the compliance manager.

6. Employee Responsibilities

6.1 As an employee of [COMPANY NAME], you must ensure that you read, understand, and comply with the information contained within this policy, and with any training or other anti-bribery and corruption information you are given.
6.2 All employees and those under our control are equally responsible for the prevention, detection, and reporting of bribery and other forms of corruption. They are required to avoid any activities that could lead to, or imply, a breach of this anti-bribery policy.
6.3 If you have reason to believe or suspect that an instance of bribery or corruption has occurred or will occur in the future that breaches this policy, you must notify the compliance manager.
6.4 If any employee breaches this policy, they will face disciplinary action and could face dismissal for gross misconduct. [COMPANY NAME] has the right to terminate a contractual relationship with an employee if they breach this anti-bribery policy.

7. What happens if I need to raise a concern?

7.1 This section of the policy covers 3 areas:
a. How to raise a concern.
b. What to do if you are a victim of bribery or corruption.
c. Protection.
7.2 How to raise a concern
If you suspect that there is an instance of bribery or corrupt activities occurring in relation to [COMPANY NAME], you are encouraged to raise your concerns at as early a stage as possible. If you’re uncertain about whether a certain action or behavior can be considered bribery or corruption, you should speak to your line manager, the compliance manager, the director, or the Head of Governance and Legal.
7.3 [COMPANY NAME] will familiarise all employees with its whistleblowing procedures so employees can vocalize their concerns swiftly and confidentially.
7.4 What to do if you are a victim of bribery or corruption
You must tell your compliance manager as soon as possible if you are offered a bribe by anyone if you are asked to make one, if you suspect that you may be bribed or asked to make a bribe in the near future, or if you have reason to believe that you are a victim of
another corrupt activity.
7.5 Protection
If you refuse to accept or offer a bribe or you report a concern relating to potential act(s) of bribery or corruption, [COMPANY NAME] understands that you may feel worried about potential repercussions. [COMPANY NAME] will support anyone who raises concerns in good faith under this policy, even if the investigation finds that they were mistaken.
7.6 [COMPANY NAME] will ensure that no one suffers any detrimental treatment as a result of refusing to accept or offer a bribe or other corrupt activities or because they reported a concern relating to potential act(s) of bribery or corruption.
7.7 Detrimental treatment refers to dismissal, disciplinary action, treats, or unfavorable treatment in relation to the concern the individual raised.
7.8 If you have reason to believe you’ve been subjected to unjust treatment as a result of a concern or refusal to accept a bribe, you should inform your line manager or the compliance manager immediately.

8. Training and communication

8.1 [COMPANY NAME] will provide training on this policy as part of the induction process for all new employees. Employees will also receive regular, relevant training on how to adhere to this policy, and will be asked annually to formally accept that they will comply
with this policy.
8.2 [COMPANY NAME] ’s anti-bribery and corruption policy and zero-tolerance attitude will be clearly communicated to all suppliers, contractors, business partners, and any third-parties at the outset of business relations, and as appropriate thereafter.
8.3 [COMPANY NAME] will provide relevant anti-bribery and corruption training to employees etc. where we feel their knowledge of how to comply with the Prevention of Corruption Act 1988 needs to be enhanced. As a good practice, all businesses should provide their employees with anti-bribery training where there is a potential risk of facing bribery or corruption during work activities.

9. Record keeping

9.1 [COMPANY NAME] will keep detailed and accurate financial records and will have appropriate internal controls in place to act as evidence for all payments made. We will declare and keep a written record of the amount and reason for hospitality or gifts accepted and given, and understand that gifts and acts of hospitality are subject to managerial review.

10. Monitoring and reviewing

10.1 [COMPANY NAME] ’s compliance manager is responsible for monitoring the effectiveness of this policy and will review the implementation of it on a regular basis. They will assess its suitability, adequacy, and effectiveness.
10.2 Internal control systems and procedures designed to prevent bribery and corruption are subject to regular audits to ensure that they are effective in practice.
10.3 Any need for improvements will be applied as soon as possible. Employees are encouraged to offer their feedback on this policy if they have any suggestions for how it may be improved. Feedback of this nature should be addressed to the compliance manager.
10.4 This policy does not form part of an employee’s contract of employment and [COMPANY NAME] may amend it at any time so to improve its effectiveness at combating bribery and corruption.

—————————End of example————————————— 

Employee’s Code of Conduct

A code of conduct is a set of rules outlining the social norms and religious rules and responsibilities of, or proper practices for, an individual, party, or organization and can be defined as “Principles, values, standards, or rules of behavior that guide the decisions, procedures, and systems of an organization in a way that (a) contributes to the welfare of its key stakeholders, and (b) respects the rights of all constituents affected by its operations.

A common code of conduct is written for employees of a company, which protects the business and informs the employees of the company’s expectations. It is ideal for even the smallest of companies to form a document containing important information on expectations for employees. The document does not need to be complex or have elaborate policies, but the file needs a simple basis of what the company expects from each employee. A Code of Conduct can be an important step in establishing an inclusive culture, but it is not a comprehensive solution on its own. An ethical culture is created by the organization’s leaders who manifest their ethics in their attitudes and behavior.] Studies of codes of conduct in the private sector show that their effective implementation must be part of a learning process that requires training, consistent enforcement, and continuous measurement/improvement. Simply requiring members to read the code is not enough to ensure that they understand it and will remember its contents. The proof of effectiveness is when employees/members feel comfortable enough to voice concerns and believe that the organization will respond with the appropriate action. There is no standard code of ethics, and broad guidelines are given which can be adapted according to the organizational culture and business requirement. Each organization’s Ethics & Compliance department is required to prepare a written Code of Conduct and implement the same within the organization. The main step has been mentioned with a brief narration and key activities required:

  1.  Mandate & commitment from top management: The Code of Conduct defines the core values of the organization thus impacting the organization’s culture. It also has an impact on the reputation of the organization as it specifies the organization’s stance towards corporate social responsibility. The involvement of senior management is a must to provide direction, funding, and resources. Obtain a formal commitment from the management and board of directors to establish the Code of Conduct. Approval for budgets for development, implementation, and regular monitoring is required. Approval for staffing the department and establishing the reporting lines is a need.
  2. Preparation of the policy document: The main policy document contains the values of the organization, management commitment to the same, details of the ethics program, and the monitoring process. Additionally, all supporting policies are mentioned. For example, if the code specifies fair and just treatment for employees, there should be additional policies relating to workplace aggression, diversity, sexual harassment, equal opportunity, etc. The core areas for the policy document needs to be identified. The main policy document needs to be supported by additional policies to ensure proper coverage and implementation. Benchmark the policy document with other organizations’ policy documents. Incorporate the legal requirements for the policy document.
  3. Approval of draft policy document: After completion of the policy document and supplementary policies the same should be approved by the senior management. The draft policy document needs to be formally approved by the top management, audit committee, and board of directors. Obtain feedback from business users to determine if they are going to face any practical difficulties in implementing it.
  4. Develop an implementation strategy: An implementation strategy is critical for the success of the program. A project plan should be developed along with the implementation strategy. The involvement of the Human Resources department is a must at this stage as they will be responsible for deploying training, incorporating the code of conduct in the appointment letters, establishing the reward system for maintaining ethics, and also the reasons for terminating employees on grounds of unethical behavior. The implementation process will require:
    • Department structure and staff requirements of the Ethics office.
    • Selection of vendors for hotline and web systems implementation in case it is not being done in-house.
    • Reward and recognition system to be established by HR.
    • Ethical values should ideally be incorporated in the balanced scorecard of the employee.
    • Training deployment strategy including the trainers, schedules, material, and evaluation system.
    • Investigation and reporting procedures for minor and major deviances
  5. Training & Awareness: Communication is the key to a successful implementation of the Code of Conduct. Various methods and sources of training should be deployed simultaneously to train the staff and external stakeholders. A training calendar should be published for rolling out the training. Explore the following ideas for building awareness and training resources:
    • Prepare classroom training material for educating the staff on the detailed policies.
    • Develop a web-based training program that includes ethical tests, case studies, and business scenarios.
    • Publish relevant cases of ethical dilemmas on the intranet
    • Provide training to existing staff and incorporate the same in induction training for the new staff.
    • Publish the relevant policies on the web for external stakeholders like suppliers, etc.
    • Issue checklists for determining how to make decisions while facing ethical dilemmas.
  6. Implementing the required hotlines and software to monitor complaints: The organization has an option to develop a web-based reporting tool internally or outsource it. Whichever the case may be, the final contact details and services should be published throughout the organization to enable staff to report complaints and discuss cases when they are facing ethical dilemmas. Undertake the following two steps for it:
    • Publish the contact numbers, email ids and websites for reporting complaints
    • Staff these 24/7 for effective monitoring or as per business requirement
  7. Reporting deviances and taking corrective action: Minor and major breaches to the Code of Conduct should be investigated properly. The report should identify the people responsible for the breach, the level of it, corrective action to be taken, and modifications required to the existing policies if any. Do the following: Conduct investigations of the cases reported and submit reports to the audit committee and board of directors. Perform root cause analysis to determine the reason for deviances, and identify solutions to mitigate the risks.
  8. Evaluating commitment to ethical values: Depending on the requirements, periodically, surveys and audits should be conducted to evaluate the adherence to the policies and the overall attitude of the organization towards ethics. One must be aware that having a Code of Conduct does not ensure that it will be followed, hence regular monitoring is required to assess adherence. Adopt the following practices:
    • Conduct an Organization Survey to evaluate employee understanding and commitment to the Code of Business Ethics.
    • Periodically audit the practices being followed by benchmarking them against the policy document.
  9. Annual update: Policies are dynamic documents subject to revisions on the basis of changing economic and legal requirements. Do an overall assessment of the existing policies on annual basis, and incorporate changes after senior management approval. Also, for all additions and modifications, send a formal communication to the staff. Use the following process:
    • Conduct an annual review of the policies.
    • Address gaps and deficiencies identified in the policies
    • Obtain management approval for the same
    • Roll out the updated policies and provide training to the staff.

The advantage of implementing a Code of Conduct is that it enhances the corporate governance efforts of the organization by establishing a uniform set of core values and behavior for all the staff. The staff knows what is the right course of action, whom to approach in a dilemma, and what will be the risks of adopting unethical behavior patterns. Due to this, the reputation and legal risks of the organization are also reduced since it is mandatory for employees to follow the law.

Example of Employee Code of conduct

In order to establish a harmonious and stable corporate environment for the sustainable development of the Company (as defined below) and realize the Company’s vision of “world-leading broadband communication and information service provider”, employees of the Company must adhere to the ethics and code of conduct in respect to their honesty, credibility, and sense of responsibility, and endeavor to maximize the interest of customers, shareholders, employees, and the society. All of the above serve as the basis of this Employee Code of conduct (the “Code of Conduct”).

1 General Provisions

1.1. Scope of Application
1.1.1. This Code of conduct is necessary to maintain the objectiveness and coordination of internal activities of the Company and important for the Company to convey its corporate spirit, quality of service, and corporate value to its customers, employees, shareholders, and society, and must be complied with by all the employees (the “Employees”) of [COMPANY NAME] and its branch companies and subsidiaries (the “Company”);
1.1.2. For Employees governed by the Code of Conduct for Management Personnel, the provisions of the Code of conduct for Management Personnel shall apply. For provisions not included in the Code of conduct for Management Personnel but included in this Code of Conduct, such provisions of this Code of Conduct shall apply;
1.1.3. Service agreements entered into between the Company and any staffing service providers shall expressly specify that staff seconded the Company shall comply with this Code of Conduct.
1.2. Performance of Duties
1.2.1. Employees of the Company should report any fraudulent behavior or behavior that violates this Code of conduct to the Supervision Department of the Company in accordance with the related reporting and processing policies and procedures;
1.2.2. The Company will provide appropriate channels, such as posting this Code of Conduct on the Company’s website, producing it prior to any business activity, or incorporating it into commercial contracts, to ensure that parties that have business relations with the Company, such as suppliers, customers, agents, investors, creditors, and debtors, are able to understand the principles and spirit of this Code of Conduct in an accurate and timely manner.

2 Honesty and Credibility

2.1. Honesty and credibility are the fundamental principles of moral characters of the Company and all Employees. All Employees shall strive to maintain honesty and credibility in their work. Employees shall be honest and credible to customers, fellow tradesmen, partners, colleagues, shareholders, the country, and society.
2.2. Due fulfillment of responsibilities is an important approach for Employees to realize the principles of honesty and credibility. Employees should be responsible and self-disciplined, adhere to principles, be loyal to their duties, serve customers with enthusiasm and efficiency, handle the duties of their positions with a sense of responsibility, safeguard the interest of the Company as well as the rights and benefits of the shareholders and should not be concerned only about their own reputation or financial gains.
2.3. Employees should develop honesty and credibility as part of their fundamental professional ethics and reflect the same in their work, faithfully carrying out their commitments. Honesty and credibility should be fundamental to the Company’s development and success and instrumental to the realization of the Company’s core values.
2.4. Employees should view their performance reports appropriately and truthfully report their performance and keep accurate billing records, in order to ensure the truthfulness and reliability of accounting information and book records, the completeness of financial reporting procedures, and the accuracy of the information submitted. False accounts, figures, or performance results are strictly prohibited.
2.5. Employees are prohibited from providing any false or misleading information within and without the Company. The information disclosure procedures shall be strictly followed.
2.6. Employees should strengthen the prevention of fraudulent behavior, in order to timely report and effectively prevent any fraudulent behavior. The Company encourages honesty and credibility as one aspect of the corporate culture by advocating and protecting Employee whistleblowing actions that truthfully expose fraudulent behaviors or behaviors that violate laws and regulations.
2.7. Employees have the obligation to comply with the current policies, laws, regulations, and other regulatory requirements of India and of the place of the Company’s listing, registration, and business operation, and perform their duties according to the current rules as well as the Articles of Association of the Company.

3 Conflict of Interest

3.1. “Conflict of interest” in this Code of Conduct shall mean any conflict that has occurred or may occur between the personal interest of Employees and the interest of the Company, or between the Employees’ personal interest and their duties. In case of a conflict of interest, Employees should promptly report to their supervisors or the Supervision Department of the Company and proceed pursuant to the responses received in a timely manner.
3.2. Employees should abide by the Articles of Association and various rules and codes of the Company, faithfully perform their duties, and consciously prevent any conflict of interest for the best interest of the Company and its shareholders.
3.3. Employees should strictly comply with the laws, regulations and regulatory requirements in respect of anti-commercial bribery, distinguish normal commercial activities from improper business behaviors, firmly rectify any improper business behavior that violates commercial morality and fair competition, and cooperate with the regulatory authorities in their investigation of any commercial bribery cases.
3.4. Employees are prohibited from illegally or inappropriately utilizing their positions or the inherent power thereof, information related to the Company’s operations or financial condition, or any information that may have a material effect on the market price of the Company’s securities for their or their families’ benefits. These activities include direct trading of securities, leaking information to others, and suggesting others for such trading.
3.5. Employees are prohibited from carrying out, causing others to carry out, or invest in any business activities that may compete with the Company’s businesses or business activities that have a conflict of interest with the Company, or with their positions.
3.6. Employees are prohibited from conducting any connected transactions that may be detrimental to the Company’s interests with any economic entities in which they or their relatives serve or hold any investment or other forms of interest in. Employees are prohibited from holding any consulting, advisory, or direct or indirect employment relationship with any customer, supplier, or competitor of the Company or hold any substantial investment interest therein.
3.7. Employees should strictly abide by the related rules and policies of the Company in respect of “excuse from the position” and “excuse from the business”.

4 Relationship with Related Parties

4.1. “Relationship with related parties” in this Code of Conduct shall mean the relationship between Employees and related parties such as customers, business partners, competitors, regulators, and other employees.
4.2. Employees should treat customers, business partners, competitors, regulators, and other employees fairly.
4.3. Employees should adhere to the “Customers First” service concept and give customer service top priority.
4.3.1. Employees should develop the market-oriented service concept and focus on providing excellent services to customers;
4.3.2. Employees should protect the customers’ confidentiality and freedom of communication and should not disclose customers’ information and confidential data without customers’ consent;
4.3.3. In marketing activities, Employees should truthfully inform customers of the Company’s services and products and fully respect customers’ freedom in making purchase decisions;
4.3.4. All Employees should respect customers’ rights and benefits and protect the legitimate interests of the Company.
4.4. When working with business partners, employees of the Company should be consistent in their words and actions.
4.4.1. In selecting production chain partners, Employees of the Company should treat all candidates fairly and objectively and reasonably select the ultimate partner through tendering and bidding and other fair means in accordance with the Company’s rules;
4.4.2. When working with business partners, all Employees of the Company should consciously safeguard the legitimate interests of the Company, strictly abide by the laws and regulations prohibiting unfair competition, monopoly, corruption, and bribery, strictly implement Company’s policies and procedures in commercial contracting and avoid unnecessary commercial risks;
4.4.3. Employees should have respect for the Company’s business partners and should not infringe upon the legitimate interests of the business partners in order to achieve mutually beneficial results for the Company and its partners.
4.5. Employees should strive to maintain a normal market competition environment and a good development environment for the Company.
4.5.1. Employees should follow society’s moral standards and the rules of the competition and are prohibited from taking inappropriate measures to interfere and interrupt network interconnection;
4.5.2. Employees should try to expand the Company’s market share by capitalizing on the Company’s advantages in services, products, and brands and are prohibited from using inappropriate means such as exaggeration or distortion of facts and defaming our competitors’ product quality, service quality, financial condition, or business reputation;

4.5.3. Employees are prohibited from using any illegal or inappropriate means to obtain any commercial secrets or other confidential information of the Company’s competitors in relation to their products, services, or marketing strategies;
4.6. All Employees of the Company should submit to the lawful supervision of the regulatory authorities, communicate as appropriate and assist in maintaining the regulation and order of the industrial market.
4.6.1. Employees should submit to the lawful supervision of the state and capital markets regulatory authorities and safeguard the legitimate interests of the Company;
4.6.2. Employees should have normal interactions with regulatory authorities and are prohibited from any inappropriate trading activities;
4.6.3. Relevant personnel should provide truthful and reliable information required by the regulatory authorities. For any omission or error, Employees should communicate with the regulatory authorities promptly and rectify such omission or error in accordance with the relevant procedures.
4.7. Employees of the Company should treat each other with trust and as equals and work as a team.
4.7.1. Employees should be warm and kind to colleagues, respect each person’s dignity, privacy, and religious beliefs;
4.7.2. Employees should work as a team and use their expertise to promote innovation and teamwork.

5 Information Disclosure and Confidentiality

5.1. Employees should strictly abide by the Company’s confidentiality rules and undertake to safeguard the Company’s commercial secrets and customers’ confidential information during the stipulated confidentiality period.
5.2. The State’s communications secrets, the Company’s commercial secrets and customer confidential information shall mean the proprietary or confidential information that has not been made public and, once made public, will be detrimental to the interests of the State, the Company and the customer, respectively, including, but not limited to, the State’s communications secrets, the Company’s operation information, strategic plans, customer data, remuneration information, marketing, and sales strategies or any other confidential information.
5.3. Employees should safely keep confidential documents, materials, and their storage media appropriately.
5.4. Employees must enter into confidentiality agreements with relevant parties when representing the Company in cooperative or business activities if disclosure of confidential information is involved.

5.5. Employees should not exchange any confidential information pertaining to the Company with any individuals, companies, or institutions or use them without authorization or entering into a confidential agreement, whether or not they are employed at the time by the Company or have benefited from such exchange or use.
5.6. Employees should strictly follow the Company’s information disclosure procedures and are prohibited from, without the Company’s permission, disclosing any confidential information of the Company to the public in their own names or in the name of the Company or make public statements relating to the Company. They are further prohibited from dispersing any false information.

6 Protecting Company Assets

6.1. Company Assets shall mean various tangible or intangible assets, trade secrets, or other professional information that the Company owns or has the right to dispose of, including favorable business opportunities.
6.2. Employees should make reasonable use of and protect Company Assets, and ensure that Company Assets are reasonably utilized to serve lawful commercial purposes. Employees are prohibited from damaging, wasting, encroaching on, embezzling, or abusing Company Assets in any way. Employees should always economize.
6.3. Employees should be risk-conscious, follow the Company’s cost control and management policies strictly and with discipline, and minimize operational risks. Management at each level and all Employees should actively minimize the potential operational risks and strengthen the monitoring and control of operational risks.
6.4. Employees should comply with safety rules and prevent accidents in order to minimize the Company’s asset loss and the Employees’ personal damages.

7 Reporting and Sanction

7.1. Any Employee who has violated this Code of Ethics is subject to Company sanctions, which include, but are not limited to, administrative sanction, termination of the labor contract, and transfer to the judicial branch.
7.2. Every employee is obligated to timely report to supervisory departments any behavior that violates this Code of Ethics pursuant to relevant rules on reporting and handling of the Company. The audit committee of the Board of Directors, Supervision Department, Audit Department, and other departments of the Company are responsible for the supervision and handling of any violation of the Company’s rules and policies. Employees can report via any of the following means:
Mail: [Company mail address ]
Internet:[xx@yy.com]
Telephone and fax: [company phone no].
7.3. The Company encourages employees to report any violation of laws, policies, or regulations. The Company welcomes Employees’ comments and suggestions on operations and management of the Company through various communication channels including “Meet with the President” Day. Management at each level should treat employee comments seriously. Policies on reporting and handling should clearly specify that the Company should provide appropriate protection to whistleblowers and maintain information and records of such whistleblowing confidential. The Company should ensure the independence of personnel receiving and processing information provided by whistleblowers, differentiate authorization levels for relevant personnel, and the de-classification authorization of archives. Personnel responsible for receiving, recording, and processing or having access to reported information should sign additional confidential agreements specifying their obligations with regard to confidentiality. The Company should also reinforce the security measures for mailboxes, hotlines, and email boxes for whistleblowing, distinguish responsibilities between the management of reported information and report investigation and strictly follow the procedures for use of information and archives.
7.4. The Company protects employees reporting violations of laws, policies, or regulations. Reporting via telephone or mail can be anonymous. Employees who leak information or retaliate against whistleblowers shall be subject to removal from position or termination of employment. Employees that violate the laws will be handed over to the prosecution.

8 Supplementary Clauses

8.1. This Code of Conduct is a regulatory document setting forth professional standards for employees of the Company. As an attachment to the labor contract, it has the same legally binding force and effect as the labor contract. Employees should also comply with the State’s laws, regulations, and administrative rules, the Articles of Associations of the Company, and various current rules and regulations within the Company.
8.2. When employees sign their labor contracts, they should also sign Employee Statement I (See Exhibit I), indicating that they know and will comply with the various provisions of this Code of Ethics and monitor and report any behavior in violation of this Code of Ethics.
8.3. Human Resource departments at each level should publicize and implement this Code of Ethics by various means, including training. They should also conduct training via mail or office system and have Employees sign Employee Statement II (see Exhibit II) annually, collect information on fraudulent behaviors and behaviors that violate this Code of Ethics and submit to supervisory organizations for investigation and decision.

8.4. This Code of Ethics is reviewed by the Legal Department of the Company and by the Employees’ Congress. It shall take effect upon approval by the Board of Directors of the Company, which also has the interpreting authority. Termination or any modification of this Code of Ethics should be approved by the Board of Directors.

Exhibit I:  Employees Statement I

I have carefully read and understood the requirements of this Employee Code of Conduct (the “Code”) of [Company name]. I acknowledge that it is an exhibit to my labor contract with equal legal binding force and effect and undertake to abide by this Code. I hereby declare the following:
1. I will abide by professional ethics and not commit fraudulent acts or behaviors in violation of this Code;
2. I will timely report any fraudulent behavior or behaviors in violation of this Code.

(Signature)

Date:

Exhibit II: Employees Statement II

1. I have strictly complied with the Employees Code of Conduct of [Company name] (the “Code”) from _________,  to _________, and have not committed any acts in violation of this Code;
2. I am not aware of any acts committed by other employees that are fraudulent or in violation of this Code. I have truthfully reported all such acts that I’m aware of to the Supervision Department.

(Signature)

Date:

—————————End of example—————————————

Example of Whistleblowing  Policy of Oman LNG L.C.C

1. Introduction
Oman LNG is committed to the highest possible standards in terms of governance practices, openness/transparency, honesty, accountability, professionalism, and duty of care in delivering one’s responsibilities as prescribed in OLNG’s “Statement of General Business Principles” and “Code of Conduct”.

2. Purpose
This Policy aims to encourage every individual working for or dealing with the Company to report any Unethical Practices at any level of the organizational structure with complete comfort, confidence, and protection. Also, it aims to define and establish the position of the Company on the framework for reporting Unethical Practices and establish suitable steps to investigate and take necessary corrective actions.

3. Definition
a. “Unethical Practice” means any behavior or practice of the Company, its employees, contractors, suppliers, or their individual employees in relation to their business dealings with the Company which is believed to be inconsistent with the Company’s General Business Principles and its general spirit, and includes, but is not limited to, the following suspected activities / improper practices:

  • Fraud or fraudulent financial reporting;
  • Manipulation of Company data/records, including forging official documents;
  • Abuse of authority at any defined level in the Company;
  •  Disclosure of confidential/proprietary information to unauthorized personnel;
  •  Knowingly violating applicable laws and regulations, thereby exposing the Company to penalties, fines, or any legal action;
  • Any instances of misappropriation or abuse of Company property/assets;
  • Actively violating any laid down Company policy, including the Code of Conduct;
  • The economically wasteful act or action;
  •  Criminal activity;
  •  Harassment of any nature to employees or any other third party.
  •  Using confidential information acquired in the course of one’s work for personal advantage;
  •  Any other activities whether unethical or improper in nature and damaging the interests of the Company;
  •  Attempts to conceal any of the above.

b. “Whistleblower” means any person (employee, director, customer, vendor, or any other individual stakeholder) reporting an Unethical Practice under this policy.

4.  Reporting Unethical Practice

a. The Company has introduced this policy to enable you to raise your concerns about Unethical Practices at an early stage and in the right way. If something is troubling you which you think the Company’s management or Board should know about or look into, then please refer to this policy.

b. Normally, concerns should be raised with the appropriate department that the issue is dealt with within the Company and should be handled in line with company policies and procedures. It is recognized, however, that there may be occasions where the use of the normal chain of command may not be appropriate. Persons may believe their concerns:

  • are overly sensitive;
  • would  not be receiving appropriate attention;
  • are of particular significance;
  • the line manager/department is the perpetrator of the issue to be addressed or
  • the person may be sufficiently uncomfortable such that it warrants the use of another confidential reporting channel. 

Hence, the Whistleblower may report such Unethical Practice in writing to WhistleBlow@omanlng.co.om. This mailbox is regularly reviewed by the Chief Internal Auditor at the Company. 

c. The Chief Internal Auditor shall never reveal the name of the Whistleblower without his/her consent unless required by law. If they at some point in time are ordered and required by law to report the name of the Whistleblower, they shall inform the Whistleblower, unless they have lawful reasons not to do so.  Where the Whistleblower feels very exposed and is afraid of being victimized (s)he can e-mail anonymously when reporting the issue by hiding his / her identity. In this respect, the Whistleblower shall provide and deliver all related information and facts with the initial report to facilitate the investigation process. The Whistleblower can remain anonymous in follow-up communications and clarifications by providing a discreet e-mail address.

d. The Whistleblower must address the following aspects, while reporting any issues under this policy:

  • A clear understanding of the issue being raised.
  • The issue should not be merely speculative in nature but should be based on actual facts.
  • Should contain as much specific information as possible to allow proper inquiry/ investigation.
  • If the Whistleblower has a personal interest in the matter, (s)he will be required to disclose this.

5. Protection to Whistleblower

The identity of the Whistleblower shall be kept confidential at all times unless otherwise agreed with the Whistleblower or required by law (e.g. during the course of any legal proceedings, where the Whistleblower is required to give evidence in court). No unfair treatment shall be vetted out towards any Whistleblower acting in good faith by virtue of his/her having reported issues under this policy and the Company shall ensure that full protection is granted to him/her against any action.

—————————End of example————————————— 

IATF 16949:2016 Clause 4.3.1 Determining the Scope of the Quality Management System and Clause 4.3.2 Customer specific requirements

The scope of  QMS must do two things :1. Meet requirements consistently and 2. Enhance customer satisfaction by the effective application of  QMS,    continual improvement of  QMS, and providing assurance of conformity to customer and applicable regulatory requirements. Your organization must have the capability to determine your customer needs and requirements; design and develop a product; know-how and capacity to manufacture a product; package product; deliver on time; provide service and support; etc. It must have the ability to repeat your capability within specified parameters for quality as defined by customers, your own organization, or regulatory bodies. To achieve and demonstrate your capabilities, you must effectively plan, operate and control the processes, within your organization that provides them. These processes collectively form the scope of your quality management system (QMS).  The effective application of your QMS can be determined by – how well QMS activities and results measure up to planned performance indicators. Continual improvement of the QMS is achieved by – increasing the ability of the QMS to meet requirements through raising the performance indicators and more efficient use of resources.   Assurance of conformity to requirements may be achieved by providing confidence that requirements will be fulfilled. This confidence may be achieved through – implementing prevention-based controls; conducting internal/external audits; 3rd party certification of your QMS; etc.   This standard provides specific requirements to effectively plan, operate, control, and improve your QMS processes. These requirements focus on prevention-based controls and to a lesser extent detection-based controls, as well as continual improvement of your QMS.   It is important to note that the does not specify requirements for the product. The focus is on your QMS and its processes. By effectively controlling and continually improving your QMS processes, there will obviously be a positive impact on product quality performance. look at regulatory requirements applicable to your organization. These requirements may come from your customer; the industry you are in; from within your own organization; or state or federal organizations. You may need to apply regulatory requirements to your suppliers and outsourced processes (subcontractors). Your ultimate objective is to enhance customer satisfaction. You achieve this by planning, operating, and improving your QMS to effectively meet customer and regulatory requirements. As this standard represents specific automotive OEMs, your QMS must provide objective evidence that your QMS processes can identify and manage these requirements and that customer-specific requirements are effectively implemented.

Scope refers to the type of automotive supply chain facilities, IATF 16949 is applicable to. “Automotive” includes cars, trucks (light, medium, and heavy), buses, motorcycles. It excludes industrial, agricultural, off-highway (mining, forestry, construction, etc.). It includes all supplier ‘sites’  providing value-added parts, components, products, sub-assemblies, and services up the supply chain to the OEM. TS 16949 requirements may be applied to any site in the supply chain by its customer. It applies to all supply chain facilities or ‘sites’ that manufacture production materials; production and service parts; assemblies; or provide (value-added) finishing services such as heat treating, welding, painting; etc., for the automotive OEM’s subscribing to this standard. This means that all Tier 1 suppliers providing such products or services directly to subscribing automotive OEMs, must get IATF 16949 certification and they in turn may flow IATF 16949 conformity or certification requirements down to Tier 2 suppliers and so on. The flow down to tier 2 or 3 has now become more the norm than the exception. The ultimate aim is that all suppliers must be certified to IATF 16949 standard. This standard cannot be applied to:

  • Automotive after-market service parts made to original subscribing OEM specifications, but not procured and released through them.
  • Manufacturers of tooling; production equipment; jigs; fixtures; molds; etc used by the auto industry.
  • Remanufactured automobile parts.
  • Distribution centers; warehouses; parts packagers; logistics support; and sequencers.

Determine whether your activities or location is a site or support function. Note that the definition of ‘site is a location where value-added manufacturing occurs and a support function is a value-adding non-manufacturing process that supports a site. The support function may be on-site or at a remote location.   The rules for third-party Certification Body (Registrar) auditing of sites and remote locations are specified in an IATF document called “Automotive Certification Scheme for IATF 16949:2016 – Rules for achieving IATF recognition”. The general rule is that sites may obtain stand-alone IATF 16949 certification, but support functions, cannot obtain stand-alone certification.    Support functions may include a variety of non-manufacturing activities such as – design; purchasing; HR; sales; distribution centers; warehousing; sequencing; logistics; etc.     All support functions (whether on-site or off-site) that support a site must be included in that site’s QMS scope. As such they must be audited to all applicable IATF 16949 requirements including their interaction with site activities. Both manufacturing, as well as support activities, maybe outsourced (i.e. performed by an independently owned organization, on your site, or off-site). Organizations performing outsourced manufacturing activity must be subject to the same TS 16949 requirements that would apply if the activity were done by your organization. Such organizations can obtain independent IATF 16949 certification if required by their customers.  Organizations performing outsourced support functions (e.g. warehousing or HR services) may be subject to specific IATF 16949 requirements imposed by their customers, however, they cannot obtain independent IATF 16949 certification for such support activities. They may obtain independent ISO 9001 certification. The organizations subscribing to the TS 16949 standard include General Motors; Ford; Daimler Chrysler; Fiat; PSA Peugeot-Citreon; Renault SA; FIEV: Opel Vauxhall; Audi; BMW; VW; Mercedes Benz; etc. The Japanese OEM’s while participating in the development of the IATF 16949 standard, do not formally subscribe to it or require it of their supply chain.

ISO 9001:2015 4.3 Determining the Scope of the Quality Management System

For explanation on ISO 9001:2015 4.3.Determining the scope of the Quality Management System click here. 

IATF 16949:2016 4.3.1 Determining the Scope of the Quality Management System- Supplement

All Supporting functions, whether they’re done in the same place as the main work or from somewhere else (like design offices, main offices, and distribution centers) should be part of the Scope of the Quality Management system(QMS) . The only time you’re allowed to not include them in the scope is when it is related to the product design and development requirements , as described in ISO 9001, Section 8.3. If you choose to leave these parts out, you need to have a good reason and write it down. But you can’t leave out the manufacturing process design.

Explanation:

In order to establish a QMS (Quality Management System) according to IATF 16949, you first need to define everything the QMS will apply to. This requirement is nothing new to quality standards, or any other management system standard, for that matter. Although it seems like just a formality, defining the scope is one of the crucial steps in the implementation and ongoing maintenance of the QMS. You will basically define to what processes, locations, products, and services your QMS applies, and this will provide input for the certification body and auditors. Requirements for the scope in IATF 16949 are based mostly on ISO 9001, but as with many other requirements, the automotive industry goes a bit further. Since ISO 9001 requirements are the first we need to meet in the implementation and are not stated in the text of the IATF 16949 standard, let’s examine them first.

Section 4.3 of the ISO 9001:2015 standard details the requirements for determining the scope of the Quality Management System. In a note about the QMS, it is stated that the QMS can include the whole organization, specifically identified functions of the organization, specifically identified sections of the organization, or one or more functions across a group of organizations. To start, there are three considerations to be included when determining the scope:

  • external and internal issues that are relevant to the purpose of the organization, the strategic direction, and the ability to achieve intended results
  • requirements of relevant interested parties
  • the product and service of the organization

In addition, the scope must state the products and services covered by the QMS, and justification for any instances where the ISO 9001 standard cannot be applied—but this requirement is further limited by IATF 16949, as you will see below. Although ISO 9001 allows organizations to decide which functions or sections will be included in the scope, IATF 16949 requires supporting functions, whether on-site or remote, to be included in the scope of the QMS. Supporting functions can be design centers, corporate headquarters, and distribution centers. This leaves far less freedom for the organization when defining the scope, and the aim is to ensure that all operations that affect the quality of products and services and/or customer satisfaction are included in the QMS scope. This will make the implementation much harder for some organizations, especially for big companies that have many locations on several continents. Customer-specific requirements also need to be evaluated and included in the scope of the QMS. In practice, this means that the organization will have to consider these requirements, and see how they reflect on the QMS, and act accordingly. For some organizations, this won’t bring anything new; however, for companies where their customers define processes, products, or services it means that they will have to include all of this in the scope of the QMS. Furthermore, the standard in this section defines the exclusions. IATF 16949 allows exclusions only from clause 8.3, and even here, with many limitations. Basically, the only requirements that can be excluded are related to the design and development of products and services. Permitted exclusions do not include manufacturing process design. Naturally, the organization will also have to provide and document justifications for exclusions. Finally, there is a requirement to document the scope; unlike ISO 9001, which doesn’t specify where and how IATF 16949 requires the Quality Manual to include the information about the scope and justifications for any exclusions.

Usually, the scope of the QMS covers the entire organization. Some noted exceptions are when your QMS only covers one physical location of a multi-location company, or when your manufacturing or service is distinctly split between industries (e.g., in a plant with three assembly lines where assembly lines 1 and 2 are for automotive and need to have a QMS certified to the ISO/TS 16949 QMS standard for automotive, but you want line 3 to be certified to ISO 9001 because many of the automotive requirements do not apply). So, your scope should identify the physical locations of the QMS, products or services that are created within the QMS processes, and the industries that are applicable, if this is relevant. It should be clear enough to identify what your business does, and if not all parts of the business are applicable, it should be identified clearly which parts are.

Your scope does not have a size limit and should include enough information to determine what is covered by the processes of the QMS. However, it is important to make clear what is included and what is not. If it is not clear to you what processes in your company are covered by your QMS, then how will it be clear to an outside auditor or other interested parties? Making your scope statement simple and easy to read can help to focus your QMS efforts, and prevent unnecessary questions about activities that may not be applicable to your QMS certification. The definition of a management system in ISO 9000:2015 for the first time provides an option to scope the system down to a single function or discipline. This was never the intent of a QMS, which was always intended to apply to an entire organization. ISO 9001:2015 also eliminated the term “permissible exclusions” by saying that if a requirement can be applied, it must be applied. Minimalists can now argue they only must include one function in their systems and incorporate only those requirements that apply to that function. IATF 16949:2016 addresses this problem in sub-clause 4.3.1, which requires support processes and value-adding sites to be included in a QMS’s scope. The previous 2008 version of ISO 9001 never mentioned omitting applicable requirements due to the geographic location of the processes. In IATF 16949:2016, where you choose to locate activities is your organization’s prerogative, but all applicable processes and requirements must be in the QMS regardless of where an organization chooses to locate and perform them. Individuals, such as auditors, who must verify whether an organization is conforming to applicable requirements must visit the locations in which those processes are being performed to verify conformance. The new ISO 9000:2015 definition of “management system” now allows for a QMS scope to be as narrow as one function. Furthermore, top management is aligned to the scope of the QMS. If a minimalist organization chose to include only the purchasing department in its scope, top management would be the purchasing executive. There is another argument that can be used by minimalist ISO 9001 implementers. A clause in IATF 16949:2016 indicates that if an ISO 9001 requirement can be applied, it must be, and product quality cannot be compromised.

For an example on how a scope could be derived please click here

Clause 4.3.2 Customer Specific requirements

“The organization should look at what each customer wants as part of its customer-specific requirements and include those things in scope of its QMS.”

Explanation:

Customer specific requirements (CSRs) as defined by IATF 16949 is “interpretations of or supplemental requirements linked to a specific clause(s) of this Automotive QMS standards

Customer-specific requirements are the requirements created by the customer with the expectation that the supplier will identify, implement, and audit these customer-specific requirements with the same intensity that they do the basic requirements of the standard. Customer-specific requirements are requirements that are outside the TS document. Had all the subscribers to the document being able to agree on these unique, very specific, company-specific requirements, then those requirements would have been written as part of the text inside TS. It is important that the audit team receiving details of customer-specific requirements well in advance of any audit (initial, surveillance, or renewal) from the organization, using them as a basis for the audit planning process. Failure to do so is viewed as an audit failure. Customer-specific requirements are those that are agreed to between the supplier and the customer. They typically fall into the following categories:

  • Part-specific requirements (dimensions, materials, performance characteristics, etc.)
  • Delivery requirements
  • Boiler-plate requirements (typically found in the purchase order)
  • General requirements (PPAP, APQP, etc.)
  • Process requirements (example: heat treat)
1

The terms customer-specific requirements and supplier quality manuals are in many ways interchangeable. Some customers refer to their documents directly as ‘Customer Specific Requirements’ while others call their documents ‘Supplier Manuals’ or ‘Supplier Quality Manuals’. The distinction, in part, is that ‘Supplier Manuals’ or ‘Supplier Quality Manuals’ often contain customer-specific requirements, as well as policies, terms, and conditions unrelated to quality. Customer-specific requirements, in their truest form, seek to expand the standard, or define how a customer wants a portion of the standard to be met. Customer-specific requirements are a component of lATF 16949 that cannot be ignored. ln fact, customer-specific requirements are more important in lATF 16949 than they were in QS-9000, which considered them as part of the requirements. Furthermore. the customer-specific requirements of Daimler Chrysler, Ford. and GM was the only essential “requirements” in implementing and auditing QS-9000. IATF I6949 changes this situation. The International Automotive Task Force (IATF), which consists of nine OEMs which include the following vehicle manufacturers: BMW Group, FCA US LLC, Daimler AG, FCA Italy Spa, Ford Motor Company, General Motors Company, PSA Group, Renault, Volkswagen AG and the vehicle manufacturers respective trade associations – AIAG (U.S.), ANFIA (Italy), FIEV (France), SMMT (U.K.) and VDA QMC (Germany) used a different strategy to create IATF 16949. When all of the IATF members could not agree on a certain clause or process, the objecting OEM put that particular clause into its own customer-specific requirements. Consequently, there are many more customer core requirements. The five Automotive Industry Action Group (AIAG) reference manuals, which were understood to be core requirements of QS-9000. are now customer-specific requirements of DaimlerChrysler. Ford. and GM.

The figure above shows that ISO 9001 is considered a base set of requirements that IATF 16949 builds upon for the automotive sector. IATF I6949 tells the supplier to conform to the company- (i.e.customer specific requirements in addition to IATF l6949’s requirements. Additional requirements may include division-specific requirements, commodity-specific requirements. or part-specific requirements. Examples of division-specific requirements include a semiconductor commodity supplier to a Daimler Chrysler plant. or a heat treat supplier to a Ford Powertrain division. The semiconductor supplier has to contend with the following requirements:
ISO 9001,  IATF 16949,  five reference manuals. which are part of DaimlerChrysler’s requirements: semiconductor commodity-specific requirements issued by the Automotive Electronics Council: and part-specific requirements from a contract review. Similarly, the heat treat supplier to Ford Powertrain has to implement ISO 9001, IATF 16949. five reference manuals. heat treat requirements specific to Ford. a DCP control plan methodology specific to the Ford Powertrain division. and part-specific requirements of that particular heat-treated part. derived from contract review. Needless to say. the customer-specific requirements have gained a whole new degree of importance in IATF In fact. customer-specific requirements will be It challenge when implementing and/or auditing IATF I6949.

Documentation Requirements For Customer-Specific  Requirements

Customer-specific documentation requirements are stated in the customer-specific documents of DaimlerChrysler. Ford, and GM. The Daimler Chrysler requirement says. “All IATF 16949 requirements and the requirements of this document (i.e.. customer-specific requirements) shall be documented in the organization’s quality system.” The Ford and GM customer-specific documents say. “All IATF 16949:2016 requirements and the requirements of this document shall be addressed by the organization’s quality system.” The DaimlerChrysler requirement asks the organization to trace each “shall“ to ensure that it has been included in the documented system. The Ford and GM requirements ask the organization and the auditor to ensure that each “shall” has been addressed by the organization’s business/quality system. Daimler Chrysler’s documentation requirements are more precise and place a greater documentation burden on the organization. Organizations should map the customer-specific requirements into their process documentation or work instructions. Through this method. both current and future employees can become knowledgeable of customer-specific requirements as they work within a process. If your organization does not use this strategy. it will have difficulty separating out customer-specific requirements and addressing the issue of how employees are to ensure process repeatability. For example. clause 8.3.5.2 of the GM customer-specific requirements says. “The organization shall have a method to identify, control, and monitor the high-risk items on those critical operations. There shall be rapid feedback and feed-forward between inspection stations and manufacturing, between departments, and between shifts. ” This is a detail that needs to be built into the process. It is not possible for a management system to address such a requirement without building it into a process. work instruction. form, or checklist.

Implementing customer specific Requirements. 

1

The strategy for addressing customer-specific requirements should be as follows. First. the organization must identify and assemble all of the customer-specific requirements from its customer base.

Customer Specific requirement checklist: for Automotive industry (considered requirements of IATF 16949)

  • It is important that utilization of accredited laboratory facilities should be specified by as per government-approved certifying body.
  • To verify, is customer approved sub-contractor service to be utilized? The approved vendor list index such information.
  • Most important is transportation mode for shipping the materials should be specified, where containers / or and any vehicle type / or and specified as surface transportation.
  • Some analytical and statistical details that possible to demand by the customer which is conducted internally for process and activities, like control plan, PFMEA, PPAP (PPAP is widely recommended and used in the automotive industry, in with some customers are demand as necessary requirements)
  • Some customer is demand detailed information about traceability requirements.
  • The stability of processes: ongoing process capability requirement should be specified; most customers can ask for it.
  • It should be clear with the customer-specific requirements, PPAP submission, and sample size, grade, and specification should be identified and confirmed from customers.
  • Is there a customer-specified method for handing complaints? Specified format for responding like 8D format, most customers are preferring standard formats but some customers are expecting some unique requirements as its application requirements.
  • Specific packing and labeling requirements should be specified. Generally packaging and labeling requirements mostly different for a single product from different customers, so it is very important to specific requirements are collected and approved by customers.

Some other requirements like MSA approval requirements, shipping notification, quality records and reviews, inspection reports, special characters and their symbol identifications, internal quality auditors’ qualifications, non-conformance details, etc. International standards – requirements mostly IATF 16949 requirements are Measurement system Analysis are consider as the primary requirement for the manufacturers of the automotive applications and same for the supplier chain that provided material to OEM & automotive applications assembling, supply chain also needs to update with the same technical specification which is automotive industries are following.

Implementation begins with training. Key supplier personnel must be trained in customer-specific requirements. Customer requirements typically come in two levels of specificity: identifying how a process should operate. or requiring an entirely new process or method. Detailed customer specifics can be implemented into processes by following a documentation strategy. Mapping the customer-specific requirements to processes is the least risky, and so the best. documentation strategy. Adopt a common process for the entire organization and clearly indicate different ways tasks should be performed to satisfy different customers. Organizations should follow these steps when adopting customer-specific requirements:

  1. Adopt the most stringent requirement.
  2. Describe how tasks may be different for different customers.
  3. Add different forms for different customers if the submission methods differ.
  4. Measure processes differently if customer measurement criteria vary.

Some customer criteria cannot be implemented just by mapping them into existing processes. Customer specifics may ask suppliers to adopt a certain system. For example. Daimler Chrysler requires the use of Power way. and Ford requires the use of a particular CAD system. Sometimes, the requirements mandate an entire implementation for e.g., MS-9000 or MMOG (by Ford) or Ford Ql requirements. Teams must be formed for these specific implementations and the mandates must be completed as a part of ISO/T S 16949 implementation.

Auditing Requirements  For Customer-Specific Requirements

Utilizing document review is the best method for determining whether the organization has already considered all of the customer-specific requirements. The internal auditor needs to have a detailed document review checklist with the “shalls” clearly delineated. The organization must complete the checklist, showing where it believes the customer-specific requirements are documented. The auditor will check to see if the processes indeed demonstrate evidence of compliance with the customer-specific requirements. As mentioned previously. some requirements are processes that would only be audited during an onsite audit. Once the auditor has checked each process and ensured that the processes demonstrate evidence of compliance with the customer’s specifics. then the requirements can be discarded and the process documentation used for the on-site audit. Trying to audit customer-specific requirements during an onsite audit without the document review is difficult and time-consuming. To understand the specific requirements matrix, let’s see what can consider requirements that customers can demands? And what kinds of customer demands or requirements are considered as specific. As on base of supplier’s previous experience with customers & routine supplies than extra things are requested by the customer that never asked before those requirements are considered as specific requirements, No it is not completely true, actually customer-specific requirements are considered on the basis of the customer’s requirements those are affecting the customer’s applications & business that concern with the quality of the products, some applications are very critical that required special measurements & Analysis to approve for the assembling, most of automotive customers requirements are almost specific. The reason very states that application of the product and its fitting criteria’s required tolerances of approval is very close that need to the analysis of the product to enhance quality with minor or zero tolerances with comparing customer’s required tolerances, there is no space for huge variation, application requirements variation of product an be very low that critical to maintaining for a supplier, that should need care at all the parameters, instructions and its follow-up strongly.

Customer Specific requirements matrix, base requirement is PPAP ( Part Production Approval Process ), it’s a specific requirement, the reason that customer buy the material for the assembling with a specific design that can possible are done in the assembly area, to match with the design of the customer engineering shop, product’s first part will be going to approval for,. Customer’s engineers are check as design provided to the supplier, match all possibilities to understand the further requirements, changes, or modifications to the finalized product. The customer-specific requirements matrix can be developed when we really fully understand the customer-specific requirements or customer’s end application’s requirements. the product we are manufacturing is installed/used at any particular part or utilize for a specific purpose of course against the customers must ask for unique requirements to match its requirements queries. To understand the customer-specific requirements, needs to verify what the really customer expects?

IATF 16949:2016 Clause 4.4.1.1 Conformance of products and processes

Conformance of products and processes is the ability of a product, service, or process to meet its design specifications. Design specifications are an interpretation of what the customer needs. Of course, a product having a high quality of conformance may still not be perceived by a customer as being an acceptable product if the person who created the design specifications did not correctly interpret what the customer wanted. Conformance is measured within an acceptable tolerance range. For example, if customers expect delivery of a car within 10 minutes of its scheduled delivery date, then any delivery time within that time frame has a high quality of conformance, while any longer interval does not. Thus, it equates to conformance to specifications within an acceptable tolerance range.

It is possible for a product to be of extremely high quality in terms of being produced within a tight tolerance range, using premium materials, and including all possible features. However, if the design specifications call for a less expensive product with fewer features, then the product is considered to have a low quality of conformance. This means that a high cost does not necessarily equate to a high quality of conformance. As an example, if a car is designed to sell at a low price, have excellent fuel economy, and operate reliably, then those are the key specifications that the actual vehicle must meet in order to have a high quality of conformance. If the vehicle were to have an oversized engine that provided more torque than necessary, it would have a low quality of conformance, because including such an engine would increase the price of the car and result in a lower fuel economy. A management technique is to track how persistently a product or service is measured close to the outer boundary established for conformance. If the measurement remains near the boundary for a significant period of time, it is likely that a breach of the measurement threshold will occur soon, so management can begin to direct attention to rectifying the issue. For example, a delivery that is consistently within just a few moments of the maximum allowable delivery threshold should be investigated. Such investigations may locate problems that can be rectified, or perhaps detect intentional measurement errors to keep the reported amounts within the conformance threshold.

Before we discuss on Conformance of products and processes, we must discuss three aspects associated with definition of quality: quality of design, quality of conformance. and quality of performance.

  1. Quality of Design
    Quality is all about set conditions that the product or service must minimally have to satisfy the requirements of the customer. Thus. the product or service must be designed in such a way so as to meet at least minimally the needs of the consumer. However. the design must be simple and also less expensive so as to meet the customers‘ product or service expectations. Quality of design is influenced by many factors. such as product type, cost, profit, policy, the demand of the availability of parts and materials, and product reliability.
  2. Quality of Conformance
    Quality of conformance is basically the standards defined in the design phase after the product is manufactured or while the service is delivered. This phase is also concerned about is control starting from raw material to the finished product. Three broad aspects are covered in this definition. viz. defect detection, defect root cause analysis. and defect prevention. Defect prevention deals with the means to deter the occurrence of defects and is usually achieved using statistical process control techniques defects maybe by inspection. testing or statistical data analysis collected fiom process, the root causes behind the presence of defects are investigated. and finally corrective actions are taken to prevent the recurrence of the defect.
  3. Quality of Performance
    Quality of performance is how well the product functions or service performs when put to use. It measures the degree to which the product or Service satisfies the customer from the perspective of both design and the quality of conformance. Meeting customer expectations is the focus when we talk about performance. Automobile industry conduct test drive of vehicles to collect information about mileage, oil consumption. Bulbs are life tested to understand their reliability during useful life. The customer survey is conducted to find customer‘s perception about service delivered. If the product or service does not live up to customer expectations then adjustments are needed in the design or conformance phase.

IATF 16949:2016 Clause 4.4.1.1 Conformance of products and processes

The organization must make sure that all its products and processes, including service parts and those outsourced, meet the relevant standards and rules set by customers, laws, and regulations.

Explanation:

All customers have needs, requirements, wants, and expectations. Needs are essential to maintain certain standards, or essential for products and services, to fulfill the purpose for which they have been acquired. Requirements are what is requested of others and may encompass needs but often are not realized until after we have been made.  Hence requirements at the moment of sale may or may not express all needs. Requirements may include wants — nice to have but not essential. Expectations are implied needs or requirements. They have not been requested because it is taken for granted — regarded as to be understood as the accepted norm. They may be things to which customers are accustomed, based on fashion, style, trends, or previous experience. In supplying products or services there are three fundamental parameters that determine their saleability. They are price, quality, and delivery. Customers require products and services of a given quality to be delivered by or be available by a given time and to be of a price that reflects value for money. If you want to know who does the best-unemployed loans able to offer you a good service, check outwww.pickaloan.co.uk for more details. These are the requirements of customers. An organization will survive only if it creates and retains satisfied customers and this will only be achieved if it offers for sale products or services that respond to customer needs and expectations as well as requirements. While the price is a function of cost, profit margin, and market forces, and delivery is a function of the organization’s efficiency and effectiveness, quality is determined by the extent to which a product or service successfully serves the purposes of the user during usage (not just at the point of sale). Price and delivery are both transient features, whereas the impact of quality is sustained long after the attraction or the pain of price and delivery have subsided. A product that possesses features that satisfy customer needs is a quality product. Likewise, one that possesses features that dissatisfy customers is not a quality product. The customer is the only one who can decide whether the quality of the products and services you supply is satisfactory and you will be conscious of this either by direct feedback or by loss of sales, reduction in market share, and, ultimately, loss of business.

Quality characteristics

Any feature or characteristic of a product or service which is needed to satisfy customer needs or achieve fitness for use is a quality characteristic. When dealing with products the characteristics are almost always technical characteristics, whereas service quality characteristics have a human dimension. Some typical quality characteristics are given in the table below.

These are the characteristics that need to be specified and their achievement controlled, assured, improved, managed, and demonstrated. When the value of these characteristics is quantified or qualified they are termed quality requirements or requirements for quality. Requirements for quality can be defined as an expression of the needs or their translation into a set of quantitatively or qualitatively slated requirements for the characteristics of an entity to enable its realization and examination.  Technical requirements for a product or service are quality requirements. In practice, characteristics are usually classified into the categories critical, major, and minor. The terms can be defined in simple terms as follows:

  1. Critical characteristic—Any feature whose Failure can reasonably be expected to present a safety hazard either to the user of the product or to anyone depending on the product functioning properly.
  2. Major characteristic—Any Feature, other than critical. whose failure would likely result in a reduction of the usability of the product.
  3. Minor characteristic—Any feature, other than major or critical. whose failure would likely be noticeable to the user.
  4. Incidental characteristic—Any Feature other than critical, major, or minor.

Of course, it is possible to develop classification schemes that are more detailed. However, the above definitions suffice for the vast majority of applications. Most often classifications of critical characteristics are noted on the drawing as well as in the manufacturing plan, as well as in such other ways as to give the user ample warning of potential hazards.

A classification of defects is the enumeration of possible defects of the unit of product classified according to their seriousness.

  1. Defect—Any nonconformance of the unit of the product with specified requirements.
  2. Defective—A product with one or more defects.
  3. Critical defect—A critical defect is a defect that judgment and experience indicate would result in hazardous or unsafe conditions for individuals using, maintaining. or depending upon the product or at defect that judgment and experience indicate is likely to prevent the performance of the tactical function of a major end item such as cars, trucks, Ship, aircraft. tank, missile. or space vehicle.
  4. Critical defective—A critical detective is a unit of Product that contains one or more critical defects and may also contain major and/or minor defects.
  5. Major defect—A major defect is a defect, other than critical, that is likely to result in failure or to reduce materially the usability of the unit of product For its intended purpose.
  6. Major defective—A major defective is a unit of product that contains one or more major defects and may also contain minor defects but contains no critical defects.
  7. Minor defect—A minor defect is a defect that is not likely to reduce materially the usability of the unit of product for its intended purpose or is a departure From established standards having little bearing on the effective use or operation of the unit.
  8. Minor defective—A minor defective is a unit of product that contains one or more minor defects but contains no critical or major defect.

Design Review and Qualification

A great deal of what We learn comes from experience. The more we do a thing, the more we learn about doing it better. As a corollary, when something is new or untried we tend to make more mistakes. Design review and qualification are performed to apply the lessons learned from experience with other products and projects to the new situation. The objective is to introduce the new item with a minimum of startup problems, errors, and engineering changes. This involves such activities as:

  • Locating qualified suppliers
  • Identifying special personnel, equipment, handling, storage, quality, and regulatory requirements
  • Providing information to marketing for forecasting, promotional. and public-relations purposes.

The design review and qualification activity is usually performed after the development of an acceptable prototype and before full—scale production. Design review often takes place in formal and informal meetings involving manufacturing, quality, and engineering personnel. In some cases, customer personnel are also present. The meetings involve the discussion of preliminary engineering drawings and design concepts. The purpose is to determine if the designs can be produced (or procured) and inspected within the cost and schedule constraints set by management. If not, one of two courses of action must be taken: 1) change the design or 2) acquire the needed production or inspection capabilities. The design review is commonly where critical and major characteristics are identified. This information is used to design functional test and inspection equipment, as well as to focus manufacturing and quality efforts on high—priority items. Formal Failure Mode, Effects and Criticality Analysis (FMECA), and Fault Tree Analysis (FTA) is also performed to assist in identification of important features. When feasible. a pilot run will be scheduled to confirm readiness for full-scale production. Pilot runs present an excellent opportunity for process capability analysis (PCA) to verify that the personnel, machines, tooling, materials, and procedure can meet the engineering requirements. The pilot run usually involves a small number of parts produced under conditions that simulate the full—scale production environment. Parts produced in the pilot run are subject to intense scrutiny to determine any shortcomings in the design, manufacturing, or quality plans. Ideally, the pilot run will encompass the entire spectrum of production, from raw materials to storage to transportation, installation, and operation in the field. Properly done, design review and qualification will result in a full-scale production plan that will minimize startup problems, errors, and engineering changes after startup. The production plan will include error-free engineering drawings, a manufacturing plan, and a quality plan. .

Process Qualification and Validation Methods

Process qualification and validation primarily control issues. One objective is to identify those processes that are capable of meeting management and engineering requirements if properly controlled. Another objective is to assure that processes are actually performing at the level which they are capable of performing, This requires that process capability be analyzed using statistical methods and that products are produced only on those processes capable of holding the required tolerances.

Dimensions of quality

In addition to quality parameters there are three dimensions of quality

  • The business quality dimension. This is the extent to which the business services the needs of society. Customers are not only interested in the quality of particular products and services but judge suppliers by the general level of quality products they provide and continuity of supply, their care of the environment, and their adherence to health, safety, and legal regulations.
  • The product quality dimension. This is the extent to which the products and service provided meet the needs of specific customers.
  • The organization quality dimension. This is the extent to which the organization maximizes its efficiency and effectiveness, achieving minimum waste, efficient management, and good human relations Companies that do not operate efficiently or do not meet their employees‘ expectations will generally find their failure costs to be high and will lose their best people. This directly affects all aspects of quality.

Many organizations only concentrate on the product quality dimension, but the three are interrelated and interdependent. Deterioration in one leads to a deterioration in the others, perhaps not immediately but eventually. As mentioned previously, it is quite possible for an organization to satisfy the customers for its products and services and fail to satisfy the needs of society. Within an organization, the working environment may be oppressive — there may be political infighting and the source of revenue so secure that no effort is made to reduce waste. Even so, such organizations may produce products and services which satisfy their customers. We must separate these three concepts to avoid confusion.

1

There are three primary organization levels: the enterprise level, the business level, and the operations level‘. Between each level there are barriers. At the enterprise level, the executive management responds to the voice of ownership and is primarily concerned with profit, return on capital employed, market share, etc. At the business level, the managers are concerned with products and services and hence respond to the voice of the customer. At the operational level, the middle managers, supervisors, operators, etc. focus on processes that produce products and services and hence respond to the voice of the processes carried out within their own function. In reality, these levels overlap, particularly in small organizations. The CEO of a small company will be involved at all three levels whereas, in the large multinational, the CEO spends all of the time at the enterprise level, barely touching the business level, except when major deals with potential customers are being negotiated. Once the contract is won, the CEO of the multinational may confine his/her involvement to monitoring performance through metrics and goals. Quality should be a strategic issue that involves the owners as it delivers fiscal performance. Low quality will cause fiscal performance ultimately to decline. The typical focus for a quality system is at the operations level. It is seen as an initiative for work process improvement. The documentation is often developed at the work process level and focused on functions. Much of the effort is focused on the processes within the functions rather than across the functions and only involves the business level at the customer interface, as illustrated in Table:.

Quality management

The basic goal of quality management is the elimination of failure: both in the concept and in the reality of our products, services, and processes. In an ideal world, if we could design products, services, and processes that could not fail we would have achieved the ultimate goal. Failure means not only that products, services, and processes would fail to fulfill their function but that their function was not what our customers desired. Hence quality management is a means for planning, organizing, and controlling the prevention of failure. All the tools and techniques that are used in quality management services to improve our ability to succeed in our pursuit of excellence. Quality does not appear by chance, or if it does it may not be repeated. One has to design quality into the products and services. It has often been said that one cannot inspect the quality of a product. A product remains the same after inspection as it did before, so no amount of inspection will change the quality of the product. However, what inspection does is measure quality in a way that allows us to make decisions on whether to release a piece of work. Work that passes inspection should be quality work but inspection unfortunately is not 100% reliable. Most inspection relies on the human judgment of the inspector and human judgment can be affected by many factors, some of which are outside our control (such as the private life, health, or mood of the inspector).

1

Several methods have evolved to achieve, sustain, and improve quality, they are quality control, quality improvement, and quality assurance, which collectively are known as quality management.

Quality control (QC)

1
1
1

Quality control is the operational techniques and activities that are used to fulfill requirements for quality. This implies that any activities, whether sewing the improvement, control, management, or assurance of quality, could be a quality control activity. They prevent change and when applied to quality regulate quality performance and prevent undesirable changes in the quality standards. Quality control is a process for maintaining standards and not for creating them. Standards are maintained through a process of selection, measurement, and correction of work, so that only those products or services that emerge from the process meet the standards. In simple terms, quality control prevents undesirable changes from being present in the quality of the product or service being supplied. The simplest form of quality control is illustrated Quality control can be applied to particular products, to processes that produce the products, or to the output of the whole organization by measuring the overall quality performance of the organization. Quality control is often regarded as a post-event activity: i.e. a means of detecting whether quality has been achieved and taking action to correct any deficiencies. However, one can control results by installing sensors before, during, or after the results are created. It all depends on where you install the sensor, what you measure, and the consequences of failure. Some failures cannot be allowed to occur and so must be prevented from happening through rigorous planning and design. Other failures are not so critical but must be corrected immediately using automatic controls or mistake-proofing. Where the consequences are less severe or where other types of sensors are not practical or possible human inspection and test can be used as a means of detecting the failure. Where the failure cannot be measured without observing trends over longer periods, you can use information controls. They do not stop immediate operations but may well be used to stop further operations when limits are exceeded. The progressive development of controls from having no control of quality to installing controls at all key stages from the beginning to the end of the life cycle is illustrated in Figure below As can be seen, if you have no controls, quality products are produced by chance and not design. The more controls you install the more certain you are of producing products of consistent quality but there is a need for balance to be achieved.

It is often deemed that quality assurance serves prevention and quality control detection, but a control installed to detect failure before it occurs serves prevention, such as reducing the tolerance band to well within the specification limits. So quality control can prevent failure. Assurance is the result of an examination whereas control produces the result. Quality assurance does not change the product, quality control does. “Quality control” is also the term used as the name of a department. In most cases, Quality Control Departments perform inspection and test activities and the name derives from the authority that such departments have been given. They sort good products from bad products and authorize the release of the good products. It is also common to find that Quality Control Departments perform supplier control activities, which are called Supplier Quality Assurance or Vendor Control. In this respect, they are authorized to release products from suppliers into the organization either from the supplier’s premises or on receipt in the organization. In recent times the inspection and test activities have been transferred into the production departments of organizations, sometimes retaining the labels and sometimes reverting to the inspection and test labels. Control of quality, or anything else for that matter, can be accomplished by the following steps:

  1. Determine what parameter is to be controlled.
  2. Establish its criticality and whether you need to control before, during, or after results are produced.
  3. Establish a specification for the parameter to be controlled which provides limits of acceptability and units of measure.
  4. Produce plans for control which specify the means by which the characteristics will be achieved and variation detected and removed.
  5. Organize resources to implement the plans for quality control.
  6. Install a sensor at an appropriate point in the process to sense variance from specification.
  7. Collect and transmit data to a place for analysis.
  8. Verify the results and diagnose the cause of variance.
  9. Propose remedies and decide on the action needed to restore the status quo.
  10. Take the agreed action and check that the variance has been corrected.

Quality improvement (Ql)

Quality improvement is the actions taken throughout the organization to increase the effectiveness of activities and processes to provide added benefits to both the organization and its customers. In simple terms, quality improvement is anything that causes a beneficial change in quality performance. There are two basic ways of bringing about improvement in quality performance. One is by better control and the other by raising standards. We don’t have suitable words to define these two concepts. Doing better what you already do is an improvement but so is doing something new. Juran uses the term control for maintaining standards and the term breakthrough for achieving new standards. Imai uses the term improvement when change is gradual and innovation when it is radical. Hammer uses the term re-engineering for radical changes. All beneficial change results in improvement, whether gradual or radical. Quality improvement (for better control) is about improving the rate at which an agreed standard is achieved. It is therefore a process for reducing the spread of variation so that all products meet agreed standards. The performance of products or processes may vary due to either random or assignable causes of variation. By investigating the symptoms of failure and determining the root cause, the assignable causes can be eliminated and the random causes reduced so that the performance of processes becomes predictable. A typical quality improvement of this type might be to reduce the spread of variation in a parameter so that the average value coincides with the nominal value (i.e. bring the parameter under control). Another example might be to reduce the defect rate from 1 in 100 to 1 in 1,000,000. Another might be simply to correct the weaknesses in the registered quality system so that it will pass reassessment.

1

Quality improvement (innovation), is about raising standards and setting a new level. New standards are created through a process that starts at a feasibility stage and progresses through research and development to result in a new standard, proven for repeatable applications. Such standards result from innovations in technology, marketing, and management. A typical quality improvement might be to redesign a range of products to increase the achieved reliability from 1 failure every 5,000 hours to 1 failure every 100,000 hours. Another example might be to improve the efficiency of the service organization so as to reduce the guaranteed call-out time from the specified 36 hours to 12 hours. The transition between where quality improvement stops and quality control begins is where the level has been set and the mechanisms are in place to keep quality on or above the set level. In simple terms, if quality improvement reduces quality costs from 25% of turnover to 10% of turnover, the objective of quality control is to prevent the quality costs from rising above 10% of turnover. Improving quality by raising standards can be accomplished by the following steps:

  1. Determine the objective to be achieved, e.g. new markets, products, or technologies, or new levels of organizational efficiency or managerial effectiveness, new national standards, or government legislation. These provide the reasons for needing change.
  2. Determine the policies needed for improvement, i.e. the broad guidelines to enable management to cause or stimulate the improvement.
  3. Conduct a feasibility study. This should discover whether accomplishment of the objective is feasible and propose several strategies or conceptual solutions for consideration. If feasible, approval to proceed should be secured.
  4. Produce plans for the improvement which specify the means by which the objective will be achieved.
  5. Organize the resources to implement the plan.
  6. Carry out research, analysis, and design to define a possible solution and credible alternatives.
  7. Model and develop the best solution and carry out tests to prove it fulfills the objective.
  8. Identify and overcome any resistance to the change in standards.
  9. Implement the change, i.e. put new products into production and new services into operation.
  10. Put in place the controls to hold the new level of performance.

This improvement process will require controls to keep improvement projects on course towards their objectives. The controls applied should be designed in the manner described previously.

1

Quality assurance (QA)

Quality assurance is all those planned and systematic actions necessary to provide adequate confidence that an entity will fulfill requirements for quality. Both customers and managers have a need for quality assurance as they are not in a position to oversee operations for themselves. They need to place trust in the producing operations, thus avoiding constant intervention. Customers and managers need:

  1. Knowledge of what is to be supplied. (This may be gained from the sales literature, contract, or agreement.)
  2. Knowledge of how the product or service is intended to be supplied. (This may be gained from the supplier’s proposal or offer.)
  3. The knowledge that the declared intentions will satisfy customer requirements if met. (This may be gained from personal assessment or reliance on independent certifications.)
  4. The knowledge that the declared intentions are actually being followed. (This may be gained by personal assessment or reliance on independent audits.)
  5. The knowledge that the products and services meet your requirements. (This may be gained by personal assessment or reliance on independent audits.)

You can gain assurance of quality by testing the product/service against prescribed standards to establish its capability to meet them. However, this only gives confidence in the specific product or service purchased and not in its continuity or consistency during subsequent supply. Another way is to assess the organization that supplies the products/services against prescribed standards to establish its capability to produce products of a certain standard. This approach may provide assurance of continuity and consistency of supply. Quality assurance activities do not control quality, they establish the extent to which quality will be, is being, or has been controlled. Quality control concerns the operational means to fulfill quality requirements, and quality assurance aims at providing confidence in this fulfillment both within the organization and externally to customers and authorities. All quality assurance activities are post-event activities and off-line and serve to build confidence in results, in claims, in predictions, etc. Quite often, the means to provide the assurance need to be built into the process, such as creating records, documenting plans, documenting specifications, reporting reviews, etc. Such documents and activities also serve to control quality as well as assure it  Assurance is not an action but a result. It results from obtaining reliable information that testifies the accuracy or validity of some event or product.  Quality Assurance Departments are often formed to provide both customer and management with confidence that quality will be, is being, and has been achieved. However, another way of looking upon Quality Assurance Departments is Corporate Quality Control. Instead of measuring the quality of products, they are measuring the quality of the business and by doing so are able to assure management and customers of the quality of products and services. Assurance of quality can be gained by the following steps

  1. Acquire the documents that declare the organization’s plans for achieving quality.
  2. Produce a plan that defines how an assurance of quality will be obtained, i.e. a quality assurance plan.
  3. Organize the resources to implement the plans for quality assurance.
  4. Establish whether the organization’s proposed product or service possesses characteristics which will satisfy customer needs.
  5. Assess operations, products, and services of the organization and determine where and what the quality risks are.
  6. Establish whether the organization’s plans make adequate provision for the control, elimination, or reduction of the identified risks.
  7. Determine the extent to which the organization’s plans are being implemented and risks contained.
  8. Establish whether the product or service being supplied has the prescribed characteristics.
1

IATF 16949:2016 Clause 4.4.1.2 Product safety

Product Safety has gained significant importance within the global automotive industry during the last few years. The numbers of re-calls were 4-times as high in 2016 as they were in 2006. The impact of those re-calls on manufacturing companies is devastating. Newspapers regularly report about major recalls in the automotive sector, in which even small product defects led to a global disaster. During a re-call, companies not only have to face direct costs but also damages to the brand image. Furthermore, there are severe penal risks for acting negligently or on intentional purpose.  Observing the increased numbers of re-calls, one might think that products became a lot more unsafe in recent years. The actual cause can rather be found in the occurrence of more strict legal requirements, increasingly stricter authority- activities, and the validity of different legal requirements in different countries. Accordingly, organizations have to follow more different and more strict external requirements, while at the same time authorities are way more active and globally interlinked than in the past. In parallel to this development, global automotive manufactures are urged to handle a constantly increasing degree of complexity. This is mainly caused by an increased variety of parts that are being produced and handled, the increasing amount and difficulties of internal and external interfaces in a global production network, and the increased manufacturing complexity. Although organizations are facing this higher complexity and stricter legal requirements, they still have to fulfill customer‘s expectations towards safety and quality. Customers do not accept a lack of quality and neither they would accept any unsafe products at any time, that’s why many companies are investing in marketing and marketing research to know exactly what the clients want, and some even will Buy Instagram followers to have a bigger client database. A recent survey showed, that safety and quality are rated as the two most relevant factors for customers during their vehicle selection process in today’s time as well as in a 25-year forecast. Safety and quality represent a key to market success within the global automotive industry. Due to the severe risks of product liability and the high degree of complexity, organizations need to be aware of, which of their processes in the value creation chain have an impact on the safety of their products. With this knowledge, they are able to install appropriate measures that ensure the conformity of processes and products and thereby contribute to improved Product safety and minimized liability risks.

Definition of product Safety

IATF defines Product Safety as ” standards relating to the design and manufacturing of products to ensure they do not represent harm or hazards to customers“. Product Safety represents a subset of quality. ISO 9000 defines Quality as the degree to which a set of inherent characteristics fulfills the requirements. The mentioned characteristics can thereby be considered as many different and numerous aspects. This includes for instance things like appearance or sustainability. Eventually, it is always the customer that judges the quality of a product or service. The special thing with the quality-characteristic safety is that no customer would ever accept any compromises and therefore always expects its complete fulfillment. Product safety can be termed as “Reliability in regard to safety-relevant defects”. Resulting in the logic that safety-relevant defects furthermore are considered as all defects that may result in a danger to humans participating in the traffic. Besides the organizational framework, the activities within the product creation process have a direct impact on the safety of the product.

Product safety is a term used to describe policies designed to protect people from risks associated with consumer products they buy and use every day. Product safety is the ability of a product to be safe for intended use, as determined when evaluated against a set of established rules. The legislation sets out clear test and documentary requirements that manufacturers and distributors must follow to demonstrate that their products meet defined safety criteria and are safe for the intended use. Evidence that the prescribed legislation has been conformed with can be demanded by the enforcement authorities within strict time frames. All consumer products must be safe and meet consumer guarantees under the product safety laws. There should be some safety standards. These standards are designed to ensure the safety of products, activities or processes, etc. The Indian consumer has the ‘right to be protected against marketing of goods and services which are hazardous to life and property (Consumer Protection Act 1986). There are many rules & regulations concerning consumer product safety in India. There are general like the Sale of Goods Act, 1930, Consumer Protection Act, 1986, Bureau of Indian Standards and Import Policy 2012 for the safety of the consumer products. To implement the rules there are mechanisms enforced by regulatory bodies. These mechanisms are operated through the Bureau of Indian Standards Act.

Cluase 4.4.1.2 Product safety

It is required that the organization must have documented processes for the management of product-safety-related products and manufacturing processes. The documented process must include if applicable identification by the organization of statutory and regulatory product safety requirements. The documented process must include if applicable customer notification of requirements in the identification of statutory and regulatory product – safety requirements. The documented process must include if applicable special approvals for design FMEA. The documented process must include if applicable identification of product safety-related characteristics. The documented process must include if applicable identification and controls of safety-related characteristics of the product and at the point of manufacture. The documented process must include if applicable special approval of control plans and process FMEAs. The documented process must include if applicable reaction plans. It must be defined responsibilities, the definition of the escalation process, and the flow of information, including top management, and customer notification. The documented process must include training identified by the organization or customer or personnel involved in product—safety-related products and associated manufacturing processes. The documented process must include changes of product or process shall be approved prior to implementation including evaluation of potential effects on product safety from the process and product changes. The documented process must include the transfer of requirements with regard to product safety throughout the supply chain, including customer-designated sources. It must include product traceability by manufactured lot (at a minimum) throughout the supply chain. It must also include The documented process must include if applicable lessons learned for new product introduction.
NOTE: Special approval is an additional approval by the function (typically the customer) that is responsible to approve such documents with safety—related content.

Explanation:

The new clause titled Product Safety requires a documented process for the management of product safety. This clause defines 13 normative elements that must be included in the documented product safety process. These 13 requirements include identification of product safety characteristics, the inclusion of safety characteristics with approvals in design and process FMEAs, control of safety characteristics at the point of the manufacturer with documentation in control plans with specific reaction plans, and defined responsibilities for product safety management including the definition of an escalation process and flow of information, including top management, and customer notification. Additionally, that personnel involved in product safety-related processes will have specific training. The new standard also requires the identification and review of safety targets as part of the product design inputs. Work instructions are required to include rules for operator safety. Product identification and traceability has been expanded to ensure the clear start and stop points for the product received by the customer or in the field that may contain quality and/or safety-related nonconformities with the same requirements extended to externally provided products with safety/regulatory characteristics. The IATF stated this requirement was strengthened to support industry lessons learned related to field issues. Control of reworked products is a new requirement in the rev 2016 standard. Within this new clause, the organization is required to obtain approval from the customer prior to commencing rework of any safety and regulatory characteristics related to the product. Disposition of Nonconforming products is another scope expansion of the new standard requiring products not meeting safety and regulatory requirements to be scrapped and rendered unusable prior to disposal. Lastly, the management review inputs are required to include a review of actual field failures and their impact on safety or the environment. The justification given by the IATF for the expansion of these requirements was to address current and emerging issues the automotive industry is facing related to product and process safety.  While some of these changes are incorporating present customer-specific requirements, others are clearly intended to drive increased awareness of safety-related issues throughout the automotive supply chain. The following 13 elements need to be included in the documented product safety process.

  • Statutory and regulatory requirements for product safety – the organization needs to identify all legal and other requirements related to product safety. This can include the methods of identification and review of this information.
  • Customer requirements regarding product safety – usually, this information is clearly stated by the customer, but there are always some requirements that are implied and are part of the Statutory and regulatory requirements for product safety.
  • Safety-related characteristics of the product – considering the lifecycle of the product and how it is used, the organization needs to identify those characteristics that are relevant for product safety.
  • Product safety-related controls at the point of manufacture – the organization needs to establish appropriate process controls to ensure that the product meets safety requirements.
  • Special approval of process FMEA and control plans – special approval is additional approval by the function (usually the customer) that is responsible for approving such documents with safety-related content.
  • Reaction plans – these usually include containment of the product and 100% inspection if necessary.
  • Responsibilities, including the escalation plan and flow of information to the top management and the customer.
  • Training for the personnel involved in the product safety and manufacturing process (training requirements can come from the organization itself or from the customer).
  • Approval of the changes in the product or process, including evaluation of the effects of the changes on the product safety.
  • Transfer of the product safety requirements throughout the supply chain, including customer-designated sources.
  • The new standard also requires the identification and review of safety targets as part of the product design inputs.
  • Product identification and traceability have been expanded to ensure the clear start and stop points for the product received by the customer, or in the field, that may contain quality- and/or safety-related nonconformities, with the same requirements extended to externally provided products with safety/regulatory characteristics. The IATF stated that this requirement was strengthened to support industry lessons learned related to field issues.
  • Control of reworked products is a new requirement in the 2016 revision of the standard. Within this new clause, the organization is required to obtain approval from the customer prior to commencing rework of any safety and regulatory characteristics related to the product.
  • Disposition of non-conforming products is another scope expansion of the new standard, requiring products not meeting safety and regulatory requirements to be scrapped and rendered unusable prior to disposal.
  • Lastly, the management review inputs are required to include a review of actual field failures and their impact on safety or the environment.

Ten Principles of Safety Management

  1. Establish and observe a written corporate safety policy.
  2. Create an independent safety review process.
  3. Identify and evaluate the severity and foreseeability of product hazards.
  4. Conduct a design review assessing the risk of injury by considering the hazards, the environment, and foreseeable use.
  5. First attempt to eliminate hazards. If not possible, then reduce the opportunity for injury by guarding against the hazards.
  6. Warn users of product dangers and motivate them to avoid injury.
  7. Promote only the safe use of a product.
  8. Maintain safety-related records during the useful life of the product.
  9. Continuously monitor the safety performance of the product in the hands of users.
  10. Promptly notify product users and institute recall procedures where necessary to substantially reduce or eliminate injury.

1. Establish and observe a written corporate safety policy.

A written corporate safety policy is the ultimate responsibility of top management. The document is designed to detail executive commitment, both statutory and voluntary, to the concept of system safety; a before-the-fact management system designed to ensure the production and distribution of reasonably safe products. Oral direction such as “safety is everyone’s responsibility” provides inadequate instructions to the organization. The policy must describe management commitment to clear identification of the responsible corporate units for the tasks of hazard identification, risk assessment, and injury control. The primary goal of a written safety policy is the creation of a management system to substantially reduce or eliminating injury to consumers.

2. Create an independent safety review process.

The independence of the safety function within the management structure is crucial to successful analysis of potential product dangers. The corporate Safety director is an advisory role, with the authority to interact with technical functions such as product design, engineering, human factors, communications, and legal. The safety manager must be able to order safety-related analyses by the various technical divisions and have the authority to integrate the results for presentation directly to top management for decisions on injury control. It is critical that the safety management office be independent of production and distribution. Giving a production manager primary responsibility for safety will divide his or her loyalties and compromise injury control before management review. The safety director often will preside over a safety review board is compromised of members from the technical divisions.

3. Identify and evaluate the severity and foreseeability of product hazards.

A hazard is the inherent capability of a product to do harm. It is most often the result of an energy transfer or release, with such transfer creating an impact on the product user. The appropriate analysis must include a focus on whether the hazard is latent to the user while foreseeable to the producer and the impact on certain vulnerable population groups. The vast majority of car drivers do not understand that Petrol and LPG leakage can create dangerous conditions when the safety valve fails to operate. A little spark can create a catastrophic explosion. Children cannot recognize strangulation hazards in and around Safety belts. Manufacturers and distributors must proceed with extra caution where the hazard is not immediately apparent to the user.

4. Conduct a design review assessing the risk of injury by considering the hazards, the environment, and foreseeable use.

Risk of injury is the opportunity for a specific set of conditions to create harm: Under what circumstances can the user be injured? An examination of the identified hazards, the environment in which it is intended to be used and foreseeable use and misuse of the product by the user population must be considered. An all-terrain vehicle, or ATV, can be an inherently unstable 300-pound machine that can throw a rider. Crushing injuries can occur in addition to the impact by overturning. ATVs are intended to be used in uncontrolled, wilderness environments, such as mountainous paths, sand dunes, and over obstacles. By creating a recreational, sometimes uninhibited setting, ATV riders can foreseeable use the product by going fast, racing with friends, or even by partaking in alcoholic beverages. While not always appropriate behavior to a safety analyst, it is foreseeable that these situations will occur and must be considered to effect reasonable safeguards to prevent injury.

5. First attempt to eliminate hazards. If not possible, then reduce the opportunity for injury by guarding against the hazards.

By eliminating a specific hazard, certain injuries cannot occur. Some automotive workshops have pits to enable work to be done. The vehicle is driven over the pit, and the mechanic works from beneath. Because carbon monoxide (from the vehicle exhaust) is heavier than air, the fumes may build up in the ‘confined space’ under the vehicle. These fumes need not be only from the vehicle being worked on: if other engines are running nearby, there is still a significant risk of exhaust emissions collecting in the pit. Using a hoist eliminates the danger. But in other cases, this is often not possible. Gasoline creates toxic and explosive fumes. It is not possible to eliminate them without destroying their usefulness. Gasoline can, however, be stored in an appropriate canister to prevent the fumes from leaking into a water heater closet in the garage causing an explosion and severe burn injuries. A power mower employs a steel blade rotating at over 200 mph, but lawnmowers can incorporate devices to shut down the blade when the operator releases the controls and can shield user access to the rotating blades.

6. Warn users of product dangers and motivate them to avoid injury.

In addition to the elimination of hazards, product warnings and instructions must assist the user to avoid dangers, including those that remain after thorough attempts to eliminate or guard. An explicit warning including a signal word, statement of the hazard, appropriate behavior, and a description of the consequences of the danger are required. A pictogram illustrating the consequences is often needed to communicate the danger, especially to those who cannot read the words. This communication of the consequences is particularly important in motivating the user to avoid the danger.

7. Promote only the safe use of a product.

Advertising and product promotion sometimes subtly and deceptively promote consumer misuse. Motorcycles promoting speeds up to 150 mph certainly encourage users to go fast, if not to the limit.  In the early years of sales, ATVs were advertised as safe, family fun. Print advertisements said the ATVs could traverse “an astonishing array of terrain”, over “rocks, boulders and fallen logs” and “where some animals can’t go.” Small, instantly removed disclaimers are insufficient to warn users of the dangers of actions depicted in advertisements. Positive statements providing safe use instructions with sufficient frequency to influence behavior are necessary to reinforce the safe activity.

8. Maintain safety-related records during the useful life of the product.

An effective product safety system requires records in sufficient detail to allow for timely detection of safety hazards and trends, and for tracing product defects in assembly, components, and overall design. Records necessary to provide sufficient data for management decisions include safety-related product changes, test results, consumer complaints, product liability lawsuits, location of products within the distribution chain, government injury data, and engineering reports. An integral part of the corporate safety policy is the establishment of a system of records and a directive concerning the retention of those documents. A document destruction policy of three years concerning a product with a useful life of seven years deprives the organization of the opportunity to protect product users from danger.

9. Continuously monitor the safety performance of the product in the hands of users.

Once a manufacturer/distributor has concluded that a product is reasonably safe based on pre-production review and analysis, the product is ready for distribution to users. Feedback from product users is critical to determining whether subsequent corrective action is necessary.  A major producer of valves distributed approximately 15,000 valves to OEM manufacturers. Reports from the field indicated the seals were not properly chlorinated, thus allowing the gasket to tear and leak gas. The company notified the Consumer Product Safety Commission under section 15(b) that the product possibly “contained a defect which could create a substantial product hazard”. An appropriate corrective action plan including the recall of the valve and notification to consumers was taken to protect consumers from the dangers of gas explosions.

10. Promptly notify product users and institute recall procedures where necessary to substantially reduce or eliminate injury.

Upon discovery of a product hazard after distribution to the public, immediate notification of the danger and quick steps to protect users from injury is critical. Time is of the essence. Knowledgeable product users can help reduce both injuries and claims. Efficient recall procedures can remove hazardous products from the stream of commerce. A few years ago, a combination of manufacturing flaws turned Toyota’s fleet of vehicles into automotive runaways. In some cases, the floor mats became lodged under the accelerator, jamming it down. In others, the gas pedal would simply stick. After more than 60 cases of runaway vehicles were reported, 30 of which resulted in at least one death, Toyota went into crisis mode and issued two separate recalls in 2009 and 2010 to “reconfigure” the accelerator setup. Company officials have estimated the cost of the blunder will top $5 billion, after all, is said and done, making it the costliest recall ever recorded.

Basic elements of  Product Safety 

Product safety involves the application of the principles of Safety Management to the design and marketing of products. Basic elements of product safety programming are designed to identify and evaluate potential product hazards for systematic control using the techniques of safety management. A Product Safety program must include a clear, explicit, and documented statement of product safety policy. It must include a clear, explicit, and documented assignment of individual responsibility for the conduct of product safety activity. It must also include a clear, explicit, and documented product safety program plan outlining the specific steps, procedures, and techniques to be followed on conducting product safety activity during the product design and marketing processes to achieve product safety goals. As a starting point, a documented search for authoritative literature and relevant standards relating to potential safety concerns associated with the product to be designed or marketed. The conduct of explicit and documented activity giving attention to the systematic discovery or identification of reasonably anticipated potential product or system hazards, followed by an evaluation of those hazards in terms of associated risk factors (likely loss event probability and severity). The documented use of the core concepts and principles of safety management and safety engineering, and the cardinal rules of hazard control, to reasonably eliminate or minimize unacceptable product hazards (though, in order of preference and effectiveness, use of design, safeguarding, or warning means). Product safety programs should appropriately include the following:

  1. Corporate Safety Policies
    Safety Product policy is a widely publicized explicit formal statement, as a matter of record, regarding top management’s commitment to state-of-the-art
    product safety and the preeminent importance of product safety during product (system) design, production, and distribution. To establish a policy the organization must:
    • Develop a mission statement to prevent unreasonable risks of injury, signed by the CEO and distributed to all employees.
    • Use all technically feasible and economically practical safety measures to substantially reduce or eliminate injuries, and to meet or exceed all applicable safety standards.
    • Create a multi-disciplinary Safety Review Committee to audit product safety policies and to consider product hazards, the environment of use, and foreseeable consumer behavior.
    • Collect and maintain safety-related data throughout the product life cycle including technical documents, injury data, complaints/returns, product liability litigation, government analyses, and other information concerning the risks of injury.
  2. Product Hazards
    • Review the inherent capability of the product to create harm through a transfer of mechanical, thermal, electrical, chemical, biological, or radiation energy.
    • Evaluate injury potential and severity.
    • The study intended and foreseeable product use in concert with operator capabilities based on demographics, anthropometric, educational level, and physical capacity.
  3. Foreseeable Use
    • Investigate how injuries occur by reviewing historical data, manuals and instructions, professional journals, and electronic databases.
    • Review government injury databases
    • Analyze internal corporate safety data on product use including customer complaints, warranty returns, toll-free lines, internal intuitive brainstorming sessions, focus groups, surveys, behavioral testing, and computer models.
  4. Risk Factors
    • The environment of use including weather, family/peers, job stress, location, ambient conditions, terrain, noise, temperature.
    • Promotion – Marketing, advertising, distribution, public relations, word of mouth, packaging, product form, and shape, point of purchase materials.
    • Vulnerable population groups such as children, seniors, and the disabled, concerning products that exceed the physical or cognitive capabilities of operators.
    • Hazard perception of the user includes the severity of the injury, likelihood or frequency of injury, magnitude of the danger, and prior experiences such as familiarity with product operations, lack of prior injury, overconfidence, and first impression of hazards and risks.
    • Benefit or value of unintended use including time savings, ease of operation, overcoming poor performance, and peer group acceptance.
  5. Safety Measures
    • Eliminate the hazard to remove the inherent capability to do harm, or if not possible, place a physical barrier, guard, or interlock between the product hazard and the user.
    • Warn the user of the danger and motivate them to avoid injury using signal words, hazard, pictorial, instructions, and statements of consequences.
    • Promote safety education including safety alerts, injury data, training, owner’s manuals, point of purchase displays.
  6. Corrective Action
    • Analysts must monitor the safety performance of products by systematic collection of injury data and other consumer use.
    • When an unreasonable risk is identified, modify future production and initiate a recall applying appropriate safety measures to repair, replace, or repurchase the defective or non-complying products.
    • The public notice includes direct mail, service bulletins, public media, paid advertising, dealer notice, point of sale posters.
    • Government requirements, Defect Notification for Motor Vehicles and Equipment such as child safety seats, and Market Withdrawal and Recall Policies.

Establishing framework for product safety

The risks for organizations and individuals that origin from PS are enormous. For example, Product liability payments are one the most severe management failures that occur because of not handling PS appropriately. Due to the inherent risks of product liability, the application of Reliable Management seems to be a necessary tool. Reliability Management can be defined as taking adequate measures to protect people, the environment, and assets from harmful consequences. Reliable management can be considered as the decisive aspect to actually focus on the essential tasks. Consequently, organizations have the responsibility to allocate their resources according to where they are most required and where most of the risks can potentially be reduced. There is not a way to eliminate risks, but therefore they need to be managed. The organizations need to know, which are their individual and relevant process that has an impact on Product Safety. If organizations have identified them, it will allow them to allocate their available resources according to the importance of the process. This again enhances the chances that tasks are fulfilled according to their requirements.

Laws and regulations can have specific impacts on products and processes. Within Product Safety, they do play a significant role. The legal requirements have their origin from product liability. Product Safety can be considered as the tool, which tries to convert legal requirements from product liability into safe products. The organizations have two main tasks for Product Safety in order to fulfill the legal requirements. Firstly, the creation of safety by the technology. This implies the technical development of a safe product (eg reliability engineering, testing, etc.). Secondly, the creation of safety by an organization that is capable of creating safety (e.g. clear responsibilities, communication, etc.). This needs to be supplemented with the creation of verification data, which allows proving the conformity of manufactured products. This became, due to the increasing numbers of lawsuits, a lot more important. The legal situation states that manufacturers are in the role to prove the product was safe at the time it was launched into the Market. Therefore, these verification records are of crucial character and can actually be decisive for the result of lawsuits. To engineers, legal requirements often seem to be described in a rather general and vague language. In order to fulfill requirements from the law legal requirements can be converted into specific working instructions. Practitioners, which in most cases do not have legal backgrounds, do require legal certainty. They need to know, what their duties are and how they can fulfill these. Therefore, specific working instructions can be created for all the processes that impact product safety.

Method of identifying the processes that are relevant for Product Safety

  1. Create a preliminary list of potentially relevant processes for Product Safety
    The first step involves the investigation of which process could possibly have an impact on PS. Therefore, interviews and comprehensive literature reviews regarding the areas of product-creation-process, reliability engineering, and enterprise models are of specific importance. All identified tasks and processes are thereby allocated to the departments that will hold responsibility for process ownership.
  2. Discuss preliminary Product Safety process with practitioners and experts from your organization
    During the second step, the preliminary Product Safety process is discussed with experts from the respective departments. A workshop with at least three members from preferably different plants is considered an important instrument to hold this discussion. This has the advantage that the proposed actions are discussed from different angles and different historical backgrounds. The active involvement of future applicants in the identification process is considered a crucial step. People are more likely to accept developments and changes, once they contributed to them. After workshops with all departments have been held, one more workshop with a focus on cross-divisional topics and interfaces between departments is advisable. Eventually, the necessity of this task has to be decided individually.
  3. Group and create a short description of all considered Processes
    Within this step, all discussed processes are grouped and consolidated. Next, a short description of each of the processes task with its purpose and goal is being created in order to avoid misunderstandings, when talking about those processes. The thereby existing list can be called ‘Preliminary Processes’.
  4. Apply the Product Safety Filter
    The filter distinguishes those activities that actually have a proven impact on Product Safety from those that only seem to be relevant. Eventually, only established process safety processes are qualified for a special treatment, which should ensure that they are conducted in the best possible way. Special treatment means that additional resources or special treatment are involved. Therefore, it is important that organizations identify the correct processes and treat only those with special care. In order to identify the process that has an impact on PS, a set of criteria has been developed. These criteria are derived from the overall goal, which is minimizing product liability risks. This goal is supported if at least one of the following two criteria applies: A special treatment of a task leads to either an improvement of the safety of a product or the minimization of liability risks. Since these two criteria are terms with a wide meaning and purpose, they need to be elaborated in order to ensure the correct filtration.

IATF 16949:2016 Internal audit checklist

 The following checklist can be used for both internal audits as well as Gap Analysis tools. The checklist given below has the requirements as given in standard IATF 16949:2016 and has to be used along with the requirements as given in Standard ISO 9001:2015. Please click here for ISO 9001:2015 Internal audit checklist

Gap-analysis
IATF 16949:2016 Checklist
Clause 4  Context of the organization
4.3 – Determining the Scope of the Quality Management System
4.3.1 – Determining the Scope of the Quality Management System-Supplemental
1 Are supporting functions, whether on-site or remote (such as design canters, corporate headquarters, and distribution canters), included in the scope of the Quality Management System (QMS)?
2Have you taken the only permitted exclusion for this Automotive QMS Standard relates to the product design and development requirements within ISO 9001, Section 8.3 (Design and development of product and services)? Is the exclusion justified and maintained as documented information? Please note Permitted exclusions do not include manufacturing process design
4.3.2 Customer – Specific Requirements
1Are customer-specific requirements evaluated and included in the scope of the organization’s quality management system?
4.4 – Quality Management System and its Processes
4.4.1.1 – Conformance of Products and Processes
1 Has the organization ensured conformance of all products and processes, including service parts and those that are outsourced, to all applicable customer, statutory, and regulatory requirements?
4.4.1.2 – Product Safety
1 Does the organization have documented processes for the management of product-safety related products and manufacturing processes?
2 Does the organization have documented processes for identification of statutory and regulatory product – safety requirements?
3 Does the organization have documented processes for customer notification of requirements in the identification of statutory and regulatory product – safety requirements?
4Does the organization have documented processes for special approvals for design FMEA?Note: Special approval is an additional approval by the function (typically the customer) that is responsible to approve such documents with safety – related content.
5 Does the organization have documented processes for identification of product safety-related characteristics?
6 Does the organization have documented processes for identification and controls of safety-related characteristics of the product and at the point of manufacture?
7 Does the organization have documented processes for special approval of control plans and process FMEAs?
8 Does the organization have documented processes for reaction plans?
9 Does the organization have documented processes for defined responsibilities, the definition of escalation process and flow of information, including top management, and customer notification?
10 Does the organization have documented processes for training identified by the organization or customer for personnel involved in product – safety-related products and associated manufacturing processes?
11 Does the organization have documented processes for changes of product or process shall be approved prior to implementation, including evaluation of potential effects on product safety from the process and product changes?
12 Does the organization have documented processes for transfer of requirements with regard to product safety throughout the supply chain, including customer – designated sources?
13 Does the organization have documented processes for product traceability by manufactured lot (at a minimum) throughout the supply chain?
14 Does the organization have documented processes for lessons learned for new product introduction?
Clause 5 Leadership
Clause 5.1 Leadership and Commitments
Clause 5.1.1 General
5.1.1.1 Leadership and Commitment – Corporate Responsibility
1 Has the organization defined and implemented corporate responsibility policies, including at a minimum an anti-bribery policy, an employee code of conduct, and an ethics escalation policy (“whistle blowing policy”)?
5.1.1.2 Process Effectiveness and Efficiency
1 Has top management reviewed the product realization processes and support processes to evaluate and improve their effectiveness and efficiency? Are the results of the process review activities included as input to the management review?
5.1.1.3 Process owners
1 Has top management identified process owners who are responsible for managing the organization’s processes and related outputs?
2 Do process owners understand their roles and are they competent to perform those roles?
5.3 Organizational Roles, Responsibilities, and Authorities
5.3.1 Organizational Roles, Responsibilities, and Authorities – Supplemental
1 Has top management assigned personnel with the responsibility and authority to ensure those customer requirements are met?
2 Have these assignments been documented?
3 Does this include but is not limited to the selection of special characteristics, setting quality objectives and related training, corrective and preventive actions, product design and development, capacity analysis, logistics information, customer scorecards, and customer portals?
5.3.2 Responsibility and Authority for Product Requirements and Corrective Actions
 1 Has top management ensured that personnel responsible for conformity to product requirements have the authority to stop shipment and stop production to correct quality problems?
 2 In case it is not possible to stop production immediately, has top management ensured that the affected batch is contained and shipment to the customer prevented?
 3 Has top management ensured that personnel with authority and responsibility for corrective action are promptly informed of products or processes that do not conform to requirements to ensure that nonconforming product is not shipped to the customer and that all potential nonconforming product is identified and contained?
 4 Has top management ensured that production operations across all shifts are staffed with personnel in charge of, or delegated responsibility for, ensuring conformity to product requirements?
6 Planning
6.1 Action to address risks and opportunities
6.1.2.1 Risk Analysis
1 Has the organization included in its risk analysis, at a minimum, lessons learned from product recalls, product audits, field returns and repairs, complaints, scrap, and rework?
2 Has the organization retained documented information as evidence of the results of risk analysis?
6.1.2.2 Preventive Actions
1 Has the organization determined and implemented action(s) to eliminate the causes of potential non conformities in order to prevent their occurrence?
2 Are preventive actions appropriate to the severity of the potential issues?
3 Has the organization established a process to lessen the impact of negative effects of risk?
4 Has the organization established a process to determining potential nonconformities and their causes?
5 Has the organization established a process to evaluate the need for action to prevent the occurrence of nonconformities?
6 Has the organization established a process of determining and implementing action needed?
7 Has the organization established a process to documented information of action taken?
8 Has the organization established a process to review the effectiveness of the preventive action taken?
9 Has the organization established a process to utilize lessons learned to prevent recurrence in similar processes?
6.1.2.3 Contingency Plans
1 Has the organization identified and evaluated internal and external risks to all manufacturing processes and infrastructure equipment essential to maintain production output and to ensure those customer requirements are met?
2 Has the organization defined contingency plans according to risk and impact to the customer?
3 Has the organization prepared contingency plans for continuity of supply in the event of key equipment failures, interruption from externally provided products, processes, and services, recurring natural disasters, fire, utility interruptions, labor shortages or infrastructure disruptions?
4 Has the organization included, as a supplement to the contingency plans, a notification process to the customer and other interested parties for the extent and duration of any situation impacting customer operations?
5 Has the organization periodically tested the contingency plans for effectiveness (e.g. simulations, as appropriate)?
6 Has the organization conducted contingency plan reviews at a minimum annually using a multidisciplinary team including top management, and updated as required?
7 Has the organization documented the contingency plans and retained documented information describing any revisions, including the person who authorized the change?
8 Do the contingency plans include provisions to validate that the manufactured product continues to meet customer specifications after the re-start of production following an emergency in which production was stopped and if the regular shutdown processes were not followed?
6.2 Quality Objectives and Planning to Achieve Them
6.2.2.1 Quality Objectives and Planning to Achieve Them – Supplemental
1 Has top management ensured that quality objectives to meet customer requirements are defined, established, and maintained for relevant functions, processes, and levels throughout the organization?
2 Are the results of the organization’s review regarding interested parties and their relevant requirements considered when the organization establishes its annual (at a minimum) quality objectives and related performance targets (internal and external)?
7 Support
7.1 Resources
7.1.3 Infrastructure
7.1.3.1 Plant, Facility, and Equipment Planning
1 Has the organization used a multidisciplinary approach including risk identification and risk mitigation methods for developing and improving plant, facility, and equipment plans?
2 In designing plant layouts has the organization optimized material flow, material handling, and value-added use of floor space including control of nonconforming product?
3 In designing plant layouts facilitated synchronous material flow?
4 Are methods developed and implemented to evaluate manufacturing feasibility for a new product or new operations?
5Do manufacturing feasibility assessments include capacity planning?
6 Are these methods also applicable for evaluating proposed changes to existing operations?
7 Has the organization maintained process effectiveness, including periodic re-evaluation relative to risk, to incorporate any changes made during process approval, control plan maintenance, and verification of job set-ups?
8 Are assessments of manufacturing feasibility and evaluation of capacity planning inputs to management reviews?
9 As applicable do these requirements should include the application of lean manufacturing principles and apply to on-site supplier activities?
7.1.4 Environment for the Operation of Processes
7.1.4.1 Environment for the Operation of Processes – Supplemental
1 Has the organization maintained its premises in a state of order, cleanliness, and repair that is consistent with the product and manufacturing process needs?
7.1.5 Monitoring and measuring resources
7.1.5.1 General
7.1.5.1.1 Measurement Systems Analysis
1 Have statistical studies been conducted to analyse the variation present in the results of each type of inspection, measurement, and test equipment system identified in the control plan?
2 Do the analytical methods and acceptance criteria used conform to those in reference manuals on measurement systems analysis? Other analytical methods and acceptance criteria may be used if approved by the customer.
3 Are records of customer acceptance of alternative methods retained along with results from alternative measurement systems analysis?
4 Is the prioritization of MSA studies focused on critical or special product or process characteristics?
7.1.5.2 Measurement traceability
7.1.5.2.1 Calibration / Verification Records
1 Does the organization have a documented process for managing calibration/verification records?
2 Are records of the calibration/verification activity for all gauges and measuring and test equipment (including employee-owned equipment relevant for measuring, customer-owned equipment, or on-site supplier-owned equipment) needed to provide evidence of conformity to internal requirements, legislative and regulatory requirements, and customer-defined requirements retained?
3 Has the organization ensured that calibration/verification activities and records include revisions following engineering changes that impact measurement systems?
4 Has the organization ensured that calibration/verification activities and records include any out-of-specification readings as received for calibration/verification?
5 Has the organization ensured that calibration/verification activities and records include an assessment of the risk of the intended use of the product caused by the out-of-specification condition?
6 Has the organization ensured that when a piece of inspection measurement and test equipment is found to be out of calibration or defective during its planned verification or calibration or during its use, documented information on the validity of previous measurement results obtained with this piece of inspection measurement and test equipment is retained, including the associated standard’s last calibration date and the next due date on the calibration report?
7 Has the organization ensured that notification is sent to the customer if the suspect product or material has been shipped?
8 Has the organization ensured that calibration/verification activities and records include statements of conformity to specification after calibration/verification?
9 Has the organization ensured that calibration/verification activities and records include verification that the software version used for product and process controls is as specified?
10Has the organization ensured that calibration/verification activities and records include records of the calibration and maintenance activities for all gauging including employee-owned equipment, customer-owned equipment, or on-site supplier-owned equipment?
11 Has the organization ensured that calibration/verification activities and records include production-related software verification used for product and process control including software installed on employee-owned equipment, customer-owned equipment, or on-site supplier-owned equipment?
7.1.5.3.1 Laboratory Requirements: Internal Laboratory
1 Does the organization’s internal laboratory facility have a defined scope that includes its capability to perform the required inspection, test, or calibration services?
2 Is this laboratory scope included in the quality management system documentation?
3 Has the laboratory specified and implemented requirements for the adequacy of the laboratory technical procedures?
4 Has the laboratory specified and implemented requirements for the competency of the laboratory personnel?
5 Has the laboratory specified and implemented requirements for testing of the product?
6 Does the laboratory have the capability to perform these services correctly, traceable to the relevant process standard such as ASTM, EN, etc.?
7 When no national or international standard(s) is available, has the organization defined and implemented a methodology to verify measurement system capability?
8 Has the laboratory specified and implemented requirements for customer requirements?
9 Has the laboratory specified and implemented requirements for review of the related records?
10 Does the Laboratory have a third-party accreditation to ISO / IEC 17025 (or equivalent) to demonstrate the organization’s in-house laboratory conformity to the above-mentioned requirements?
7.1.5.3.2 Laboratory Requirements: External Laboratory
1 Do external/ commercial/ independent laboratory facilities used for inspection, test, or calibration services by the organization have a defined laboratory scope that includes the capability to perform the required inspection, test, or calibration?
2 Is the external laboratory accredited to ISO / IEC 17025 or national equivalent and includes the relevant inspection, test, or calibration service in the scope of the accreditation (certificate) where the certificate of calibration or test report includes the mark of a national accreditation body; or there is evidence that the external laboratory is acceptable to the customer?
NOTE: Such evidence may be demonstrated by customer assessment, for example, or by the customer-approved second-party assessment that the laboratory meets the intent of ISO/IEC 17025 or national equivalent. The second-party assessment may be performed by the organization assessing the laboratory using a customer-approved method of assessment. Calibration services maybe be performed by the equipment manufacturer when a qualified laboratory is not available for a given piece of equipment. In such cases, the organization shall ensure that the requirements listed in Section 7.1.5.3.1 have been met. Use of calibration services, other than by qualified (or customer accepted) laboratories, may be subject to government regulatory confirmation if required.
7.2 Competence
7.2.1 Competence – Supplemental
1 Has the organization established and maintained a documented process for identifying training needs including awareness and achieving competence of all personnel performing activities affecting conformity to product and process requirements?
2 Are personnel performing specific assigned tasks qualified, as required, with particular attention to the satisfaction of customer requirements?
7.2.2 Competence – On-The-Job Training
1 Does the organization provide on-the-job training, which includes customer requirements training, for personnel in any new or modified responsibilities affecting conformity to quality requirements, internal requirements, regulatory or legislative requirements?
2 Does this include contract or agency personnel?
3 Is the level of detail required for on-the-job training commensurate with the level of education the personnel possess and the complexity of the task they are required to perform for their daily work?
4 Are persons whose work can affect quality informed about the consequences of nonconformity to customer requirements?
7.2.3 Internal Auditor Competency
 1 Does the organization have a documented process to verify that internal auditors are competent, taking into account any customer-specific requirements?
 2 Does the organization maintain a list of qualified internal auditors?
3.  Are quality management system auditors, manufacturing process auditors, and product auditors all able to demonstrate the understanding of the automotive process approach for auditing, including risk-based thinking?
 4 Are the auditors able to demonstrate the understanding of applicable customer-specific requirements?
 5 Are the auditors able to demonstrate the understanding of applicable ISO 9001 and IATF 16949 requirements related to the scope of the audit?
 6 Are the auditors able to demonstrate the understanding of applicable core tool requirements related to the scope of the audit?
 7 Are the auditors able to demonstrate the understanding of how to plan, conduct, report, and closeout audit findings?
 8 Do manufacturing process auditors demonstrate technical understanding of the relevant manufacturing process to be audited, including process risk analysis such as PFMEA and control plan?
 9 Do product auditors demonstrate competence in understanding product requirements and use of relevant measuring and test equipment to verify product conformity?
 10 Where training is provided to achieve competency, is documented information retained to demonstrate the trainer’s competency with the above requirements?
 11 Is maintenance of and improvement in internal auditor competence demonstrated through executing a minimum number of audits per year, as defined by the organization?
 12 Is maintenance of and improvement in internal auditor competence demonstrated through maintaining knowledge of relevant requirements based on internal changes (e.g. process technology, product technology) and external changes (e.g. ISO 9001, IATF 16949, core tools, and customer-specific requirements)?
7.2.4 Second-Party Auditor Competency
 1 Does the organization demonstrate the competence of the auditors undertaking the second-party audits?
 2 Do second-party auditors meet customer-specific requirements for auditor qualification and demonstrate the understanding of the automotive process approach to auditing, including risk-based thinking?
 3 Do second-party auditors demonstrate the understanding of applicable customer and organization-specific requirements?
 4 Do second-party auditors demonstrate the understanding of applicable ISO 9001 and IATF 16949 requirements related to the scope of the audit?
 5 Do second-party auditors demonstrate the understanding of applicable manufacturing process to be audited, including PFMEA and control plan?
 6 Do second-party auditors demonstrate the understanding of applicable core tool requirements related to the scope of the audit?
 7 Do second-party auditors demonstrate the understanding of how to plan, conduct, prepare audit reports, and closeout audit findings
7.3 Awareness
7.3.1 Awareness – Supplemental
 1 Does the organization maintain documented information that demonstrates that all employees are aware of their impact on product quality and the importance of the activities in achieving, maintaining, and improving quality, including customer requirements and the risks involved for the customer with the non-conforming product?
7.3.2 Awareness – Employee Motivation and Empowerment
1 Does the organization maintain a documented process to motivate employees to achieve quality objectives, to make continual improvements, and to create an environment that promotes innovation?
2 Does the process include the promotion of quality and technological awareness throughout the whole organization?
7.5 Documented Information
7.5.1 General
7.5.1.1 Documented Information: Quality Management System Documentation
1 Is the organization’s quality management system documented and includes a quality manual, which can be a series of documents (electronic or hard copy)?
2 Is the format and structure of the quality manual at the discretion of the organization and does it depend on the organization’s size, culture, and complexity?
3 If a series of documents is used, is a list retained of the documents that comprise the quality manual for the organization?
4 Does the quality manual include the scope of the quality management system, including details of and justification for any exclusions?
5 Does the quality manual include documented processes established for the quality management system or reference to them?
6 Does the quality manual include the organization’s processes and their sequence and interactions (inputs and outputs), including type and extent of control of any outsourced processes?
7 Does the quality manual include a document (ie. matrix) indicating where within the organization’s quality management system their customer-specific requirements are addressed?
NOTE: A matrix of how the requirements of this Automotive QMS standard are addressed by the organization’s processes may be used to assist with linkages of the organization’s processes and this Automotive QMS.
7.5.3 Control of Documented Information
7.5.3.2.1 Record Retention
1 Does the organization define, document, and implement a record retention policy?
2 Do the control of records satisfy statutory, regulatory, organizational, and customer requirements?
3 Are production part approvals, tooling records including maintenance and ownership, product and process design records, purchase orders (if applicable), or contracts and amendments retained for the length of time that the product is active for production and service requirements, plus one calendar year unless otherwise specified by the customer or regulatory agency?
4 Does Production part approval documented information include approved product, applicable test equipment records, or approved test data?
7.5.3.2.2 Control of Documented Information: Engineering Specifications
1 Does the organization have a documented process describing the review, distribution, and implementation of all customer engineering standards/specifications and related revisions based on customer schedules, as required?
2  Does the organization retain a record of the date on which each change is implemented in production?
3 Does the implementation include updated documents?
4 Is review completed within 10 working days of receipt of notification of engineering standards/specification changes?
NOTE: A change in these standards/specifications may require an updated record of customer production part approval when these specifications are referenced on the design record or if they affect documents of the production part approval process, such as control plan, risk analysis (such as FMEAs), etc.
8 Operations
8.1 Operational Planning and Control
8.1.1 Operational Planning and Control – Supplemental
1 When planning for product realization, are the following topics including a) customer product requirements and technical specifications b) logistics requirements c) manufacturing feasibility d) project planning e) acceptance criteria?
8.1.2 Confidentiality
1 Has the organization ensured the confidentiality of customer-contracted products and projects under development, including related product information?
8.2 Requirements for Products and Services
8.2.1 Customer Communication
8.2.1.1 Customer Communication – Supplemental
1 Is written or verbal communication in the language agreed with the customer?
2 Does the organization have the ability to run ransomware analysis and communicate necessary information, including data in a customer-specified computer language and format e.g. computer-aided design data, electronic data interchange?
8.2.2 Determining the Requirements for Products and Services
8.2.2.1 Determining the Requirements for Products and Services – Supplemental
1 Do these requirements include recycling, environmental impact, and characteristics identified as a result of the organization’s knowledge of the product and manufacturing processes?
2 Does compliance with any statutory and regulatory requirement related to the product include all applicable government, safety, and environmental regulations related to the acquisition, storage, handling, recycling, elimination, or disposal of material?
8.2.3 Review of the Requirements for Products and Services
8.2.3.1.1 Review of the Requirements for Products and Services – Supplemental
1 Does the organization retain documented evidence of a customer-authorized waiver for the requirements stated in ISO 9001, Section 8.2.3.1, for a formal review?
8.2.3.1.2  Customer-Designated Special Characteristics
1 Does the organization conform to customer requirements for designation, approval documentation, and control of special characteristics?
8.2.3.1.3 Requirements for Products and Services: Organization Manufacturing Feasibility
1 Does the organization utilize a multidisciplinary approach to conduct an analysis to determine if it is feasible that the organization’s manufacturing processes are capable of consistently producing a product that meets all of the engineering and capacity requirements specified by the customer?
2 Does the organization conduct this feasibility analysis for any manufacturing or product technology new to the organization and for any changed manufacturing process or product design?
3 Additionally, does the organization validate through production runs, benchmarking studies, or other appropriate methods, their ability to make the product to specifications at the required rate?
8.3 Design and development of products and services
8.3.1 General
8.3.1.1 Design and development of products and services – supplement
1 Does the requirement of product and manufacturing process design and development focus on error prevention rather on detection?
1 Does the organization document its design and development processes?
8.3.2 Design and Development Planning 
8.3.2.1 Design and Development Planning – Supplemental
1 Does the organization ensure that design and development planning includes all affected stakeholders within the organization and, as appropriate, its supply chain?
2 While doing the design and development planning, does the organization uses as a multidisciplinary approach which includes a) project management (for example, APQP or VDA – RGA); b) product and manufacturing process design activities (for example, DFM and DFA), such as consideration of the use of alternative designs and manufacturing processes; c) development and review of product design risk analysis (FMEAs), including actions to reduce potential risks; d) development and review of manufacturing process risk analysis (for example, FMEAs, process flows, control plans, and standard work instructions)?
NOTE: A multidisciplinary approach typically includes the organization’s design, manufacturing, engineering, quality, production, purchasing, supplier, maintenance, and other appropriate functions.
8.3.2.2 Product Design Skills
1 Does the organization ensure that personnel with product design responsibility are competent to achieve design requirements and are skilled in applicable product design tools and techniques?
2 Are applicable tools and techniques identified by the organization?
8.3.2.3 Development of Products with Embedded Software
1 Does the organization use a process for quality assurance for their products with internally developed embedded software?
2 Is a software development assessment methodology utilized to assess the organization’s software development process?
3 Using prioritization based on risk and potential impact to the customer, does the organization retain documented information of a software development capability self-assessment?
4 Does the organization include software development within the scope of its internal audit programme?
8.3.3 Design and Development Inputs
8.3.3.1 Product Design Input
1 Does the organization identify, document, and review product design input requirements as a result of contract review?
2 Do product design input requirements include product specifications including but not limited to special characteristics?
3 Do product design input requirements include boundary and interface requirements?
4 Do product design input requirements include identification, traceability, and packaging?
5 Do product design input requirements include consideration of design alternatives?

NOTE: One approach for considering design alternatives is the use of trade-off curves.
6 Do product design input requirements include assessment of risks with the input requirements and the organization’s ability to mitigate/manage the risks, including from the feasibility analysis?
7 Do product design input requirements include targets for conformity to product requirements including preservation, reliability, durability, serviceability, health, safety, environmental, development timing, and cost?
8 Do product design input requirements include applicable statutory and regulatory requirements of the customer-identified country of destination, if provided?
9 Do product design input requirements include embedded software requirements?
10 Does the organization have a process to deploy information gained from previous design projects, competitive product analysis (benchmarking), supplier feedback, internal input, field data, and other relevant sources for current and future projects of a similar nature?
8.3.3.2 Manufacturing Process Design Input
 1 Does the organization identify, document, and review manufacturing process design input requirements?
 2 Does the manufacturing process design input requirements including but not limited to the following: a) product design output data including special characteristics; b) targets for productivity, process capability, timing, and cost; c) manufacturing technology alternatives; d) customer requirements, if any; e) experience from previous developments; f) new materials; g) product handling and ergonomic requirements; and h) design for manufacturing and design for assembly?
3 Does the manufacturing process design include the use of error-proofing methods to a degree appropriate to the magnitude of the problems and commensurate with the risks encountered?
8.3.3.3 Special Characteristics
 1 Does the organization use a multidisciplinary approach to establish, document, and implement its process to identify special characteristics, including those determined by the customer and the risk analysis performed by the organization?
 2  Does it include documentation of all special characteristics in the drawings (as required), risk analysis (such as FMEA), control plans, and standard work/operator instructions; special characteristics identified with specific markings and cascaded through each of these documents?
 3 Does the identification of special characteristics include the development of control and monitoring strategies for special characteristics of products and production processes?
 4 Does the identification of special characteristics include customer-specified approvals, when required?
 5 Does the identification of special characteristics include compliance with customer-specified definitions and symbols or the organization’s equivalent symbols or notations, as defined in a symbol conversion table?
 6  Is the symbol conversion table submitted to the customer, if required?
8.3.4 Design and Development Controls
8.3.4.1 Monitoring
 1 Are measurements at specified stages during the design and development of products and processes defined, analyzed, and reported with summary results as an input to management review?
 2  When required by the customer, are measurements of the product and process development activity reported to the customer at stages specified, or agreed to, by the customer?
 3 When appropriate, do these measurements include quality risks, costs, lead times, critical paths, and other measurements?
8.3.4.2 Design and Development Validation
1 Is design and development validation performed in accordance with customer requirements, including any applicable industry and governmental agency-issued regulatory standards?
2 Is the timing of design and development validation planned in alignment with customer-specified timing, as applicable?
3 Where contractually agreed with the customer, does this include evaluation of the interaction of the organization’s product, including embedded software, within the system of the final customer’s product?
8.3.4.3 Prototype Programme
1 When required by the customer, does the organization have a prototype programme and control plan?
2 Does the organization use, whenever possible, the same suppliers, tooling, and manufacturing processes as used in production?
3 Are all performance-testing activities monitored for timely completion and conformity to requirements?
4 When services are outsourced, does the organization include the type and extent of control in the scope of its quality management system to ensure that outsourced services conform to requirements?
8.3.4.4 Product Approval Process
1 Does the organization establish, implement, and maintain a product and manufacturing approval process conforming to requirements defined by the customer?
2 Does the organization approve externally provided products and services per ISO 9001, Section 8.4.3 (Information for the external provider), prior to submission of their part approval to the customer?
3 Does the organization obtain documented product approval prior to shipment, if required by the customer? Are records of such approval retained?
4 Are records of such approval retained?
NOTE: Product approval should be subsequent to the verification of the manufacturing process.
8.3.5 Design and Development Outputs
8.3.5.1 Design and Development Outputs – Supplemental
1 Is the product design output expressed in terms that can be verified and validated against product design input requirements?
2 Does the product design output include design risk analysis (Design FMEA)?
 3 Does the product design output include reliability study results?
 4  Does the product design output include product special characteristics?
 5  Does the product design output include results of product design error-proofing, such as DFSS, DFMA and FTA?
 6  Does the product design output include product definition including 2D drawing, 3D models, technical data packages, product manufacturing information, and geometric dimensioning & tolerancing (GD & T)?
 7 Does the product design output include product design review results?
 8  Does the product design output include service diagnostic guidelines and repair and serviceability instructions?
 9 Does the product design output include service part requirements?
 10 Does the product design output include packaging and labelling requirements for shipping?
 11 Does the Interim design outputs include any engineering problems being resolved through a trade-off process?
8.3.5.2 Manufacturing Process Design Output
 1 Does the organization document the manufacturing process design output in a manner that enables verification against the manufacturing process design inputs?
 2 Does the organization verify the outputs against manufacturing process design input requirements?
 3 Does the manufacturing process design output include specifications and drawings?
 4 Does the manufacturing process design output include special characteristics for the product and manufacturing process?
 5 Does the manufacturing process design output include identification of process input variables that impact characteristics?
 6 Does the manufacturing process design output include tooling and equipment for production and control, including capability studies of equipment and process?
 7 Does the manufacturing process design output include manufacturing process flowcharts/layout, including linkage of product, process, and tooling?
 8 Does the manufacturing process design output include capacity analysis?
 9  Does the manufacturing process design output include manufacturing process FMEA?
 10 Does the manufacturing process design output include maintenance plans and instructions?
 11 Does the manufacturing process design output include the control plan?
12 Does the manufacturing process design output include standard work and work instructions?
13 Does the manufacturing process design output include process approval acceptance criteria?
14 Does the manufacturing process design output include data for quality, reliability, maintainability, and measurability?
15 Does the manufacturing process design output include results of error-proofing identification and verification, as appropriate?
16 Does the manufacturing process design output include methods of rapid detection, feedback, and correction of product/manufacturing process nonconformities?
8.3.6 Design and Development Changes
8.3.6.1 Design and Development Changes – Supplemental
1 Does the organization evaluate all design changes after initial product approval, including those proposed by the organization or its suppliers, for potential impact on fit, form, function, performance, and/or durability?
2 Are these changes validated against customer requirements and approved internally, prior to production implementation?
3 If required by the customer, does the organization obtain documented approval, or a documented waiver, from the customer prior to production implementation?
4 For products with embedded software, does the organization document the revision level of software and hardware as part of the change record?
8.4 Control of externally provided processes, products and services
8.4.1 General
8.4.1.1 General – Supplemental
1 Does the organization include all products and services that affect customer requirements such as sub-assembly, sequencing, sorting, rework, and calibration services in the scope of their definition of externally provided products, processes, and services?
8.4.1.2 Supplier Selection Process
 1 Does the organization have a documented supplier selection process?
 2 Does the selection process include an assessment of the selected supplier’s risk to product conformity and uninterrupted supply of the organization’s product to the customers?
 3 Does the selection process include relevant quality and delivery performance?
 4 Does the selection process include an evaluation of the supplier’s quality management system?
 5  Does the selection process include multidisciplinary decision making?
 6 Does the selection process include an assessment of software development capabilities, if applicable?
 7 Are other supplier selection criteria considered including the following: volume of automotive business (absolute and as a percentage of total business); financial stability; purchased product, material, or service complexity; required technology (product or process); adequacy of available resources (e.g. people, infrastructure); design and development capabilities (including project management);  manufacturing capability; change management process; business continuity planning (e.g. disaster preparedness, contingency planning); logistics process; customer service
8.4.1.3 Customer-Directed Sources (also known as “Directed-Buy”)
1 When specified by the customer, does the organization purchase products, materials, or services from customer-directed sources?
 2 Are all requirements of Section 8.4 (except the requirements in IATF 16949, Section 8.4.1.2) applicable to the organization’s control of customer-directed sources unless specific agreements are otherwise defined by the contract between the organization and the customer?
8.4.2 Type and Extent of Control
8.4.2.1 Type and Extent of Control – Supplemental
1 Does the organization have a documented process to identify outsourced processes and to select the types and extent of controls used to verify the conformity of externally provided products, processes, and services to internal (organizational) and external customer requirements?
2 Does the process include the criteria and actions to escalate or reduce the types and extent of controls and development activities based on supplier performance and assessment of the product, material, or service risks?
8.4.2.2 Statutory and Regulatory Requirements
1 Does the organization document their process to ensure that purchased products, processes, and services conform to the current applicable statutory and regulatory requirements in the country of receipt, the country of shipment, and the customer-identified country of destination if provided?
2 If the customer defines special controls for certain products with statutory and regulatory requirements, does the organization ensure they are implemented and maintained as defined, including at suppliers?
8.4.2.3 Supplier Quality Management System Development
1 Does the organization require their suppliers of automotive products and services to develop, implement, and improve a quality management system certified to ISO 9001, unless otherwise authorized by the customer, with the ultimate objective of becoming certified to this Automotive QMS Standard?
Unless otherwise specified by the customer, is the following sequence applied to achieve this requirement:  
compliance to ISO 9001 through second-party audits;
certification to ISO 9001 through third-party audits; unless otherwise specified by the customer, do suppliers to the organization demonstrate conformity to ISO 9001 by maintaining a third-party certification issued by a certification body bearing the accreditation mark of a recognized IAF MLA (International Accreditation Forum Multilateral Recognition Arrangement) member and where the accreditation body’s main scope includes management system certification to ISO / IEC 17021;
certification to ISO 9001 with compliance to other customer-defined QMS requirements (such as Minimum Automotive Quality Management System Requirements for Sub-Tier Suppliers [MAQMSR] or equivalent) through second-party audits;
certification to ISO 9001 with compliance to IATF 16949 through second-party audits;
certification to 16949 through third-party audits (valid third-party certification of the supplier to IATF 16949 by an IATF-recognized certification body)?
8.4.2.3.1 Automotive product-related software or automotive products with embedded software
1 Does the organization require their suppliers of automotive product-related software, or automotive products with embedded software, to implement and maintain a process for software quality assurance for their products?
2 Is a software development assessment methodology utilized to assess the supplier’s software development process?
3 Using prioritization based on risk and potential impact to the customer, does the organization require the supplier to retain documented information of a software development capability self-assessment?
8.4.2.4 Supplier Monitoring
1 Does the organization have a documented process and criteria to evaluate supplier performance in order to ensure the conformity of externally provided products, processes, and services to internal and external customer requirements?
2 At a minimum, are the following supplier performance indicators monitored:   delivered product conformity to requirements;
customer disruptions at the receiving plant, including yard, holds and stop ships;
delivery schedule performance;
the number of occurrences of premium freight?
3 If provided by the customer, does the organization also include the following, as appropriate, in their supplier performance monitoring:  
special status customer notifications related to quality or delivery issues;
dealer returns, warranty, field actions, and recalls?
8.4.2.4.1 Second-party audits
1 Does the organization include a second-party audit process in its supplier management approach?
Second-party audits may be used for the following: a) supplier risk assessment; b) supplier monitoring; c) supplier QMS development; d) product audits; e) process audits.
2 Based on risk analysis, including product safety/regulatory requirements, the performance of the supplier, and QMS certification level, at a minimum, does the organization document the criteria for determining the need, type, frequency, and scope of second-party audits? Does the organization retain records of the second-party audit reports?
3 If the scope of the second-party audit is to assess the supplier’s quality management system, is the approach consistent with the automotive process approach?
8.4.2.5 Supplier Development
1 Does the organization determine the priority, type, extent, and timing of required supplier development actions for its active suppliers?
2 Do determination inputs include performance issues identified through supplier monitoring?
3 Do determination inputs include second-party audit findings?
4 Do determination inputs include third-party quality management system certification status?
5 Do determination inputs include risk analysis?
6 Does the organization implement actions necessary to resolve open (unsatisfactory) performance issues and pursue opportunities for continual improvement?
8.4.3 Information for External Providers 
8.4.3.1 Information for External Providers – Supplemental
1 Does the organization pass down all applicable statutory and regulatory requirements and special product and process characteristics to their suppliers and require the suppliers to cascade all applicable requirements down the supply chain to the point of manufacture?
8.5 Production and Service provision
8.5.1 Control of Production and Service provision
8.5.1.1 Control Plan
1 Does the organization develop control plans at the system, subsystem, component, and/or material level for the relevant manufacturing site and all product supplied, including those for processes producing bulk materials as well as parts?
2 Are family control plans acceptable for bulk material and similar parts using a common manufacturing process?
3 Does the organization have a control plan for pre-launch and production that shows linkage and incorporates information from the design risk analysis (if provided by the customer), process flow diagram, and manufacturing process risk analysis outputs (such as FMEA)?
4 Does the organization, if required by the customer, provide measurement and conformity data collected during execution of either the pre-launch or production control plans?
5 Does Control plan include controls used for the manufacturing process control, including verification of job set-ups?
6 Does Control plan include first-off / last-off part validation, as applicable?
7 Does Control plan include methods for monitoring of control exercised over special characteristics, defined by both the customer and the organization?
8 Does Control plan include the customer-required information, if any?
9 Does Control plan includes a specified reaction plan when nonconforming product is detected, the process becomes statistically unstable or not statistically capable?
10 Does the organization review control plans and update when it has shipped nonconforming product to the customer?
11 Does the organization review control plans and update when any change occurs affecting product, manufacturing process, measurement, logistics, supply sources, production volume changes, or risk analysis (FMEA)?
12 Does the organization review control plans and update after a customer complaint and implementation of the associated corrective action, when applicable?
13 Does the organization review control plans and update at a set frequency based on a risk analysis?
14 If required by the customer, does the organization obtain customer approval after review or revision of the control plan?
8.5.1.2 Standardised Work – Operator Instructions and Visual Standards
1 Does the organization ensure that standardised work documents are communicated to and understood by the employees who are responsible for performing the work?
2 Is it legible and presented in the language understood by the personnel responsible to follow them?
3 Is it accessible for use at the designated work area?
4 Do the standardised work documents also include rules for operator safety?
8.5.1.3 Verification of Job Set-Ups
1 Does the organization verify job set-ups when performed, such as an initial run of a job, material changeover, or job change that requires a new set-up?
2 Does the organization maintain documented information for set-up personnel?
3 Does the organization use statistical methods of verification, where applicable?
4 Does the organization perform first-off/last-off part validation, as applicable; where appropriate, are first-off parts retained for comparison with the last-off parts; where appropriate, are last-off parts retained for comparison with first-off parts in subsequent runs?
5 Does the organization retain records of process and product approval following set-up and first-off/last-off part validations?
8.5.1.4 Verification After Shutdown
1 Does the organization define and implement the necessary actions to ensure product compliance with requirements after a planned or unplanned production shutdown period?
8.5.1.5 Total Productive Maintenance
 1 Does the organization develop, implement, and maintain a documented total productive maintenance system?
 2 Does the system include identification of process equipment necessary to produce the conforming product at the required volume?
 3 Does the system include the availability of replacement parts for the equipment identified?
 4 Does the system include the provision of resource for the machine, equipment, and facility maintenance?
 5 Does the system include packaging and preservation of equipment, tooling, and gauging?
 6 Does the system include applicable customer-specific requirements?
 7 Does the system include documented maintenance objectives, for example, OEE (Overall Equipment Effectiveness), MTBF (Mean Time Between Failure), and MTTR (Mean Time To Repair), and Preventive Maintenance compliance metrics?
 8 Does performance to the maintenance objectives form an input into management review?
 9 Does the system include a regular review of maintenance plan and objectives and a documented action plan to address corrective actions where objectives are not achieved?
 10  Does the system include the use of preventive maintenance methods?
 11 Does the system include the use of predictive maintenance methods, as applicable?
 12  Does the system include periodic overhaul?
8.5.1.6 Management of Production Tooling and Manufacturing, Test, Inspection Tooling and Equipment
 1  Does the organization provide resources for tool and gauge design, fabrication, and verification activities for production and service materials and for bulk materials, as applicable?
 2 Does the organization establish and implement a system for production tooling management, whether owned by the organization or the customer?
 3 Does the Production tooling management include maintenance and repair facilities and personnel?
 4 Does Production tooling management include storage and recovery?
 5 Does Production tooling management include set-up and tool-change programmes for perishable tools?
 6 Does the Production tooling management include tool design modification documentation, including engineering change level of the product?
 7 Does the Production tooling management include tool modification and revision to documentation?
 8 Does the Production tooling management include tool identification, such as serial or asset number; the status, such as production, repair or disposal; ownership; and location?
 9  Does the organization verify that customer-owned tools, manufacturing equipment, and test/inspection equipment are permanently marked in a visible location so that the ownership and application of each item can be determined?
 10  Does the organization implement a system to monitor these activities if any work is outsourced?
8.5.1.7 Production Scheduling
1 Does the organization ensure that production is scheduled in order to meet customer orders/demands such as Just-In-Time (JIT) and is supported by an information system that permits access to production information at key stages of the process and is order-driven?
2 Does the organization include relevant planning information during production scheduling, e.g. customer orders, supplier on-time delivery performance, capacity, shared loading (multi-part station), lead time, inventory level, preventive maintenance, and calibration?
8.5.2 Identification and Traceability 
8.5.2.1 Identification and Traceability – Supplemental
1 Does the organization implement identification and traceability processes to support identification of clear start and stop points for product received by the customer or in the field that may contain quality and/or safety-related nonconformities?
2 Does the organization conduct an analysis of internal, customer, and regulatory traceability requirements for all automotive products, including developing and documenting traceability plans, based on the levels of risk or failure severity for employees, customers, and consumers?
3 Do these plans define the appropriate traceability systems, processes, and methods by product, process, and manufacturing location?
4 Do these plans enable the organization to identify nonconforming and/or suspect product?
5 Do these plans enable the organization to segregate non-conforming and/or suspect product?
6 Do these plans ensure the ability to meet the customer and/or regulatory response time requirements?
7 Do these plans ensure documented information is retained in the format (electronic, hardcopy, archive) that enables the organization to meet the response time requirements?
8 Do these plans ensure serialized identification of individual products, if specified by the customer or regulatory standards?
9 Do these plans ensure the identification and traceability requirements are extended to externally provided products with safety/regulatory characteristics?
8.5.4 Preservation
8.5.4.1 Preservation – Supplemental
1 Does preservation include identification, handling, contamination control, packaging, storage, transmission or transportation, and protection?
2 Does preservation apply to materials and components from external and/or internal providers from receipt through processing, including shipment and until delivery to/acceptance by the customer?
3 In order to detect deterioration, does the organization assess at appropriate planned intervals the condition of the product in stock, the place/type of storage container, and the storage environment?
4 Does the organization use an inventory management system to optimize inventory turns over time and ensure stock rotation, such as “first-in-first-out” (FIFO)?
5 Does the organization ensure that obsolete product is controlled in a manner similar to that of the nonconforming product?
6 Do organizations comply with preservation, packaging, shipping, and labeling requirements as provided by their customers?
8.5.5 Post Delivery activities
8.5.5.1 Feedback of Information from Service
1 Does the organization ensure that a process for communication of information on service concerns to manufacturing, material handling, logistics, engineering, and design activities is established, implemented, and maintained?
2 Is the organization aware of nonconforming products and materials that may be identified at the customer location or in the field. ?
3 Where applicable does “Service Concerns” include the results of field failure test analysis?
8.5.5.2 Service Agreement with Customer
1 When there is a service agreement with the customer, does the organization verify that the relevant service centres comply with applicable requirements?
2 Does the organization verify the effectiveness of any special purpose tools or measurement equipment?
3 Does the organization ensure that all service personnel are trained in applicable requirements?
8.5.6 Control of Changes
8.5.6.1 Control of Changes – Supplemental
1 Does the organization have a documented process to control and react to changes that impact product realization?
2 Are the effects of any change, including those changes caused by the organization, the customer, or any supplier, assessed?
3 Does the organization define verification and validation activities to ensure compliance with customer requirements?
4 Does the organization validate changes before implementation?
5 Does the organization document evidence of related risk analysis ?
6 Does the organization retain records of verification and validation?
7 Do changes, including those made at suppliers, require a production trial run for verification of changes such as changes to part design, manufacturing location, or manufacturing process to validate the impact of any changes on the manufacturing process?
8 When required by the customer, does the organization notify the customer of any planned product realization changes after the most recent product approval?
9 When required by the customer, does the organization obtain documented approval, prior to the implementation of the change?
10 When required by the customer, does the organization complete additional verification or identification requirements, such as production trial run and new product validation?
8.5.6.1.1 Temporary Change of Process Controls
1 Does the organization identify, document, and maintain a list of the process controls, including inspection, measuring, test, and error-proofing devices, that includes the primary process control and the approved back-up or alternate methods?
2 Does the organization document the process that manages the use of alternate control methods?
3 Does the organization include in this process, based on risk analysis (such as FMEA), severity, and the internal approvals to be obtained prior to production implementation of the alternate control method?
4 Before shipping product that was inspected or tested using the alternate method, if required, does the organization obtain approval from the customer(s)?
5 Does the organization maintain and periodically review a list of approved alternate process control methods that are referenced in the control plan?
6 Are standard work instructions available for each alternate process control method?
7 Does the organization review the operation of alternate process controls on a daily basis, at a minimum, to verify the implementation of standard work with the goal to return to the standard process as defined by the control plan as soon as possible? Example methods include but are not limited to the following:
daily quality-focused audits (e.g. layered process audits, as applicable)
daily leadership meetings.
8 Is restart verification documented for a defined period based on severity and confirmation that all features of the error-proofing device or process are effectively reinstated?
9 Does the organization implement traceability of all product produced while any alternate process control devices or processes are being used (e.g. verification and retention of the first piece and last piece from every shift)?
8.6 Release of Products and Services
8.6.1 Release of Products and Services – Supplemental
 1 Does the organization ensure that the planned arrangements to verify that the product and service requirements have been met encompass the control plan and are documented as specified in the control plan?
 2 Does the organization ensure that the planned arrangements for the initial release of products and services encompass product or service approval?
 3 Does the organization ensure that product or service approval is accomplished after changes following the initial release, according to ISO 9001, Section 8.5.6?
8.6.2 Layout Inspection and Functional Testing
 1 Is a layout inspection and a functional verification to applicable customer engineering material and performance standards performed for each product as specified in the control plans?
 2 Are results available for customer review?
NOTE 1: Layout inspection is the complete measurement of all product dimensions shown on the design record(s). NOTE 2: The frequency of layout inspection is determined by the customer.
8.6.3 Appearance Items
 1 For organizations manufacturing parts designated by the customer as “appearance items”, does the organization provide appropriate resources, including lighting, for evaluation?
 2Does the organization provide masters for colour, grain, gloss, metallic brilliance, texture, distinctness of image (DOI), and haptic technology, as appropriate?
 3 Does the organization provide maintenance and control of appearance masters and evaluation equipment?
 4 Does the organization provide verification that personnel making appearance evaluations are competent and qualified to do so?
8.6.4 Verification and Acceptance of Conformity of Externally Provided Products and Services
 1 Does the organization have a process to ensure the quality of externally provided processes, products, and services utilizing one or more of the following methods:
receipt and evaluation of statistical data provided by the supplier to the organization;
receiving inspection and/or testing, such as sampling based on performance;
second-party or third-party assessments or audits of supplier sites when coupled with records of acceptable delivered product conformance to requirements;
part evaluation by a designated laboratory;
another method agreed with the customer?
8.6.5 Statutory and Regulatory Conformity
 1Prior to the release of externally provided products into its production flow, does the organization confirm and is it able to provide evidence that externally provided processes, products, and services conform to the latest applicable statutory, regulatory, and other requirements in the countries where they are manufactured and in the customer-identified countries of destination if provided?
8.6.6 Acceptance Criteria
 1 Is acceptance criteria defined by the organization and, where appropriate or required, approved by the customer?
 2 For attributed data sampling, is the acceptance level zero defects?
8.7 Control of Non conforming outputs
8.7.1.1 Customer Authorization for Concession
1 Does the organization obtain a customer concession or deviation permit prior to further processing whenever the product or manufacturing process is different from that which is currently approved?
2 Does the organization obtain customer authorization prior to further processing for “use as is” and rework dispositions of the nonconforming product?
3 If sub-components are reused in the manufacturing process, is that sub-component reuse clearly communicated to the customer in the concession or deviation permit?
4 Does the organization maintain a record of the expiration date or quantity authorized under concession?
5 Does the organization also ensure compliance with the original or superseding specifications and requirements when the authorization expires?
6 Is material shipped under concession properly identified on each shipping container (this applies equally to purchased product)?
7 Does the organization approve any requests from suppliers before submission to the customer?
8.7.1.2 Control of Nonconforming Product – Customer – Specified Process
 1 Does the organization comply with applicable customer-specified controls for the nonconforming product?
8.7.1.3 Control of Suspect Product
 1 Does the organization ensure that product with unidentified or suspect status is classified and controlled as a nonconforming product?
 2 Does the organization ensure that all appropriate manufacturing personnel receive training for containment of suspect and non-conforming product?
8.7.1.4 Control of Reworked Product
1 Does the organization utilize risk analysis (such as FMEA) methodology to assess risks in the rework process prior to a decision to rework the product?
2 If required by the customer, does the organization obtain approval from the customer prior to commencing rework of the product?
3 Does the organization have a documented process for rework confirmation in accordance with the control plan or other relevant documented information to verify compliance with original specifications?
4 Are instructions for disassembly or rework, including re-inspection and traceability requirements, accessible to and utilized by the appropriate personnel?
5 Does the organization retain documented information on the disposition of reworked product including quantity, disposition, disposition date, and applicable traceability information?
8.7.1.5 Control of Repaired Product
1 Does the organization utilize risk analysis (such as FMEA) methodology to assess risks in the repair process prior to a decision to repair the product?
2 Does the organization obtain approval from the customer before commencing repair of the product?
3 Does the organization have a documented process for repair confirmation in accordance with the control plan or other relevant documented information?
4 Are instructions for disassembly or repair, including re-inspection and traceability requirements, accessible to and utilized by the appropriate personnel?
5 Does the organization obtain documented customer authorization for a concession for the product to be repaired?
6 Does the organization retain documented information on the disposition of repaired product including quantity, disposition, disposition date, and applicable traceability information?
8.7.1.6 Customer Notification
 1 Does the organization immediately notify the customers in the event that nonconforming product has been shipped?
 2 Is initial communication followed with detailed documentation of the event?
8.7.1.7 Nonconforming Product Disposition
1 Does the organization have a documented process for disposition of nonconforming product not subject to rework or repair?
2 For product not meeting requirements, does the organization verify that the product to be scrapped is rendered unusable prior to disposal?
3 The organization shall not divert nonconforming product to service or other use without prior customer approval.
9. Performance evaluation
9.1 Monitoring, measurement, analysis and evaluation
9.1.1 General
9.1.1.1 Monitoring and Measurement of Manufacturing Processes
1 Does the organization perform process studies on all new manufacturing (including assembly or sequencing) processes to verify process capability and to provide additional input for process control, including those for special characteristics?
2For manufacturing processes where it may not be possible to demonstrate product compliance through process capability, are alternate methods such as batch conformance to the specification used?
3 Does the organization maintain manufacturing process capability or performance results as specified by the customer’s part approval process requirements?
4 Does the organization verify that the process flow diagram, PFMEA, and control plan are implemented?
5Does the organization adherence to the following:
measurement techniques;
sampling plans;
acceptance criteria;
records of actual measurement values and/or test results for variable data;
reaction plans and escalation process when acceptance criteria are not met
6 Are significant process events, such as tool change or machine repair, recorded and retained as documented information?
7 Does the organization initiate a reaction plan indicated on the control plan and evaluated for impact on compliance to specifications for characteristics that are either not statistically capable or are unstable?
8 Does these reaction plans include containment of product and 100 percent inspection, as appropriate?
9 Is a corrective action plan developed and implemented by the organization indicating specific actions, timing, and assigned responsibilities to ensure that the process becomes stable and statistically capable.?
10 Do the organization review the plans with and approved by the customer, when required. ?
11 Does the organization maintain records of effective dates of process changes.?
9.1.1.2 Identification of Statistical Tools
1 Does the organization determine the appropriate use of statistical tools?
2 Does the organization verify that appropriate statistical tools are included as part of the advanced product quality planning (or equivalent) process and included in the design risk analysis (such as DFMEA) (where applicable), the process risk analysis (such as PFMEA), and the control plan?
9.1.1.3 Application of Statistical Concepts
1 Are statistical concepts, such as variation, control (stability), process capability, and the consequences of over-adjustment, understood and used by employees involved in the collection, analysis, and management of statistical data?
9.1.2. Customer satisfaction
9.1.2.1 Customer Satisfaction – Supplemental
1 Is customer satisfaction with the organization monitored through continual evaluation of internal and external performance indicators to ensure compliance to the product and process specifications and other customer requirements?
2 Are performance indicators based on objective evidence and include but not limited to the following: a) delivered part quality performance?
3 Does performance indicators include customer disruptions?
4 Does performance indicators include field returns, recalls, and warranty (where applicable)?
5 Does performance indicators include delivery schedule performance (including incidents of premium freight)?
6 Does performance indicators include customer notifications related to quality or delivery issues, including special status?
7 Does the organization monitor the performance of manufacturing processes to demonstrate compliance with customer requirements for product quality and process efficiency?
8 Does the organization monitor the performance of manufacturing processes to demonstrate compliance with customer requirements for product quality and process efficiency?
9 Does the organization monitor the performance of manufacturing processes to demonstrate compliance with customer requirements for product quality and process efficiency?
10 Do the organization record analytical results and do the organization retain and control these records?
9.1.3. Analysis and evaluation
9.1.3.1 Prioritization
1 Are trends in quality and operational performance compared with progress toward objectives and lead to action to support prioritization of actions for improving customer satisfaction?
9.2 Internal Audit
9.2.2.1 Internal Audit Programme
1 Does the organization have a documented internal audit process?
2 Does the process include the development and implementation of an internal audit programme that covers the entire quality management system including quality management system audits, manufacturing process audits, and product audits?
3 Is the audit programme prioritized based upon risk, internal and external performance trends, and criticality of the processes?
4 Where the organization is responsible for software development, does the organization include software development capability assessments in their internal audit programme?
5 Is the frequency of audits reviewed and, where appropriate, adjusted based on the occurrence of process changes, internal and external nonconformities, and/or customer complaints?
6 Is the effectiveness of the audit programme reviewed as a part of the management review?
9.2.2.2 Quality Management System Audit
1 Does the organization audit all quality management system processes over each three-year calendar period, according to an annual programme, using the process approach to verify compliance with this Automotive QMS Standard?
2 Integrated with these audits, does the organization sample customer-specific quality management system requirements for effective implementation?
9.2.2.3 Manufacturing Process Audit
1 Does the organization audit all manufacturing processes over each three-year calendar period to determine their effectiveness and efficiency using customer-specified required approaches for process audits?
2 Where not defined by the customer, does the organization determine the approach be used?
3 Within each individual audit plan, is each manufacturer process audited on all shifts where it occurs, including the appropriate sampling of the shift handover?
4 Does the manufacturing process audit include an audit of the effective implementation of the process risk analysis (such as PFMEA), control plan, and associated documents?
9.2.2.4 Product Audit
1 Does the organization audit products using customer-specific required approaches at appropriate stages of production and delivery to verify conformity to specified requirements?
2 Where not defined by the customer, does the organization define the approach to be used?
9.3 Management review
9.3.1 General
9.3.1.1 Management Review – Supplemental
1 Is management review conducted at least annually?
2 Is the frequency of management review(s) increased based on risk to compliance with customer requirements resulting from internal or external changes impacting the quality management system and performance-related issues?
9.3.2 Management review inputs
9.3.2.1 Management Review Inputs – Supplemental
1 Does input to management review include the cost of poor quality (cost of internal and external nonconformance)?
2 Does input to management review include measures of process effectiveness?
3 Does input to management review include measures of process efficiency?
4 Does input to management review include product conformance?
5 Does input to management review include assessments of manufacturing feasibility made for changes to existing operations and for new facilities or new product?
6 Does input to management review include customer satisfaction?
7 Does input to management review include a review of performance against maintenance objectives?
8 Does input to management review include warranty performance where applicable?
9 Does input to management review include a review of customer scorecards where applicable?
10 Does input to management review include identification of potential field failures identified through risk analysis (such as FMEA)?
11 Does input to management review include actual field failures and their impact on safety or the environment?
9.3.3 Management review outputs
9.3.3.1 Management Review Outputs – Supplemental
1 Does top management document and implement an action plan when customer performance targets are not met
10 Improvement
10.2 Non-conformity and corrective action
10.2.3 Problem Solving
1 Does the organization have documented processes for problem-solving?
2 Has the organization defined approaches for various types and scale of problems (e.g. new product development, current manufacturing issues, field failures, audit findings)?
3 Does the process include containment, interim actions, and related activities necessary for control of nonconforming outputs?
4 Does it include root cause analysis, the methodology used, analysis, and results?
5 Does it include implementation of systemic corrective actions, including consideration of the impact on similar processes and products?
6 Does the organization verify the effectiveness of implemented corrective actions?
7 Does the organization reviews and, where necessary, update the appropriate documented information (e.g. PFMEA, control plan)?
8 Where the customer has specified prescribed processes, tools, or systems for problem-solving, does the organization use those processes, tools, or systems, unless otherwise approved by the customer?
10.2.4 Error-Proofing
1 Does the organization have a documented process to determine the use of appropriate error-proofing methodologies?
2 Are details of the method used documented in the process risk analysis (such as PFMEA) and are test frequencies documented in the control plan?
3 Does the process include the testing of error-proofing devices for failure or simulated failure?
4 Are records maintained?
5 Are challenge parts, when used, identified, controlled, verified, and calibrated where feasible?
6 Do error-proofing device failures have a reaction plan?
10.2.5 Warranty Management Systems
1 When the organization is required to provide a warranty for its products, does the organization implement a warranty management process?
2 Does the organization include in the process a method for warranty part analysis, including NTF (no trouble found)?
3 When specified by the customer, does the organization implement the required warranty management process?
10.2.6 Customer Complaints and Field Failure Test Analysis
1 Does the organization perform analysis on customer complaints and field failures, including any returned parts, and does it initiate problem-solving and corrective action to prevent recurrence?
2 Where requested by the customer, does this include analysis of the interaction of embedded software of the organization’s product within the system of the final customer’s product?
3 Does the organization communicate the results of testing/analysis to the customer and also within the organization?
10.3 Continual improvement
10.3.1 Continual Improvement – Supplemental
1 Does the organization have a documented process for continual improvement?
2 Does it include the identification of the methodology used, objectives, measurement, effectiveness, and documented information?
3 Does it include a manufacturing process improvement action plan with emphasis on the reduction of process variation and waste?
4 Does it include risk analysis (such as FMEA)?
NOTE: Continual improvement is implemented once manufacturing processes are statistically capable and stable or when product characteristics are predictable and meet customer requirements.

Back to Home Page

If you need assistance or have any doubt and need to ask any question contact me at preteshbiswas@gmail.com. You can also contribute to this discussion and I shall be happy to publish them. Your comment and suggestion are also welcome.

Design for Six Sigma

 Common DFSS Methodologies

1

Design for six sigma(DFSS) is the suggested method to bring order to product design. Hockman, Suh, and Paul, have noted that 70% – 80% of all quality problems are design related. Emphasis on the manufacturing side alone will concentrate at the tail end of the problem solving process. The emphasis should be at the front end. Problem solving at the downstream end is more costly and time consuming than fixing it at the source.  In 1999, NIST reported that the automotive supply chain lost at least a billion dollars a year due to poor interoperability of digitally designed product data. There has been considerable emphasis in recent years by American industry in downsizing, restructuring, process redesign, and instituting cost containment, etc. These methods are directed at holding the line on costs. This can be described as denominator management. In the business world, the equation for return on investment, or return on net operating assets, has both a numerator – net income, and a denominator – investment. Managers have found cutting the denominator, investments in people, resources, materials, or other assets is an easy way to make the desired return on investment rise (at least short-term). To grow the numerator of the equation requires a different way of thinking. That thinking must include ways to increase sales or revenues. One of the ways to increase revenues must include introducing more new products for sale to customers. The new products account for a large percentage of company ‘s sales (40%), and profits (46%). Of course, not every new product will survive. Two studies listed in Table below provide some statistics.

Progression of New Products Through Development

Table indicates that a large amount of ideas are needed. These ideas are sorted, screened, and evaluated in order to obtain feasible ideas, which enter the development stage, pass into launch stage, and become successful products. Cooper provides more details of how winning products are obtained:

  1. A unique, superior product: This is a product with benefits and value for the customer.
  2. A strong market orientation: An understanding of customer needs and wants exists.
  3. Predevelopment work: Up front activities such as screening, market analysis, technical assessment, market research, and business analysis are vital before development starts.
  4. Good product definition: A company must undertake good product and project definition before development begins.
  5. Quality of execution: The development process has many steps. A company must execute these steps with the proper amount of detail and correctness.
  6. Team effort: Product development is a team effort that includes research & development, marketing, sales, and operations.
  7. Proper project selection: Poor projects must be killed at the proper time. This provides adequate resources for the good projects.
  8. Prepare for the launch: A good product launch is important and resources must be available for future launches.
  9. Top management leadership: Management has a role to play in the product development process. They must provide guidance, strategy, resources, and leadership.
  10. Speed to market: Product development speed is the weapon of choice, but sound management practices should be maintained.
  11. A new product process: This is a screening (stage gate) process for new products.
  12. An attractive market: An attractive market makes it easier to have a successful product.
  13. Strength of company abilities: The new product provides a synergy between the company and internal abilities.

There are many product development processes to choose from. Rosenau suggests that the former “relay race” process (one function passing the product  from marketing to engineering to manufacturing and back through the loop) is obsolete. Multi-functional team activities involving all departments are necessary for effectiveness and speed to market. The process is comprised of 2 parts: a “fuzzy front end” (idea generation and sorting) and new product development (NPD). The complete NPD process includes 5 activities:-

  1. Concept study: A study is needed to uncover the unknowns about the market, technology, and/ or the manufacturing process.
  2. Feasibility investigations: There is a need to determine the limitations of the concept. Find out if the unknowns are resolvable, or if new research improves the project.
  3. Development of the new product: This is the start of the NPD process. This includes the specifications, needs of the customer, target markets, establishment of multi-functional teams, and determination of key stage gates.
  4. Maintenance: These are the post delivery activities associated with product development.
  5. Continuous learning: Project status reports and evaluations are needed to permit learning.

Stage Gate Process

A stage gate process is used by many companies to screen and pass projects as they progress through development stages. Each stage of a project has requirements that must be fulfilled. The gate is a management review of the particular stage in question. It is at the various gates that management should make the “kill” decision. Too many projects are allowed to live beyond their useful lives and clog the system. This dilutes the efforts of project teams and overloads the company resources. Table below illustrates some sample stages.

1

Product Development Stages for Various Companies

The above Table presents several examples of new product development processes. The individual organization should customize their process and allow a suitable time period for it to stabilize.

Product Development

In the area of new product management, there are  describe some commonly accepted new product terms:

  1. New-to-the-world products: These are inventions and discoveries that include products like Polaroid cameras, laser printers, in-line skates, etc.
  2. New category entries: These are company products that are not new to the world, but new to the company. A “me-too” type product.
  3.  Additions to product lines: These products are extensions of the organization’s existing product line. Examples are Diet Coke, Caffeine-free Coke.
  4. Product improvements: Current products made better.
  5. Repositioning: Products that are retargeted for a new use. The original purpose was not broad enough. Arm & Hammer baking soda has been repositioned as a drain deodorant, refrigerator deodorant, etc.
  6. Cost reductions: New products which are designed to replace existing  products, but at a lower cost.

GE Plastics has formalized their product design development process. It is described as designing for six sigma using the product development process. The methodology is used to produce engineered plastics through a series of tollgates that describe the elements needed for completion of a stage. The best practices are used in each stage. Best practices include:

  • Understanding critical to quality characteristics for external customers and internal customers
  • Conducting failure mode and effects analysis (FMEA)
  • Performing design of experiments to identify key variables
  • Benchmarking other facilities using competitive analysis, surveys, etc.

Treffs, Simon and Shree provide additional insight on the  development  of other six sigma design methods. A standardized approach has not yet been established, but most authors recommend a framework that tries to remove “gut feel” and substitutes more control.

IDOV

Treffs  presents a four step IDOV model:

  • Identify: Use a team charter, VOC, QFD, FMEA, and benchmarking.
  • Design: Emphasize CTQs, identify functional requirements, develop alternatives, evaluate, and select.
  • Optimize: Use process capability information, statistical tolerancing, robust design, and various six sigma tools.
  • Validate: Test and validate the design.

DMADV

Simon  provides a five step define, measure, analyze, design and validate (DMADV) process for six sigma design. The DMADV method for the creation of a new product consists of the following steps:

  •  Define: Define the project goals and customer needs
  • Measure: Measure and determine customer needs and specifications
  •  Analyze: Analyze the process options to meet customer needs
  • Design: Develop the process details to meet customer needs
  • Verify: Verify and validate the design performance

DMADOV

The six sigma DMADOV process is used to develop new processes or products at high quality levels, or if a current process requires more than just incremental improvement. DMADOV is an acronym for define, measure, analyze, design, optimize, and verify. The process steps for a DMADOV project include:

  1. Define the project:
    • What are the projects goals?
    • Who is the customer and what are their requirements?
  2. Measure the opportunity:
    • Determine customer needs and specifications
    • Benchmark competitors and industry
  3. Analyze the process options:
    • What option will meet the customer needs?
    •  Determine creative solutions
  4. Design the process:
    • Develop a detailed process
    • Design experiments that verify the design meets customer needs
  5. Optimize the process:
    • Test the new process to evaluate performance levels and impacts
    • Re-design the process, as necessary, to meet customer specifications
  6. Verify the performance:
    • Verify the design performance and ability to meet customer needs
    • Deploy the new process

The French Design Model
The design is named after a British author named Michael Joseph French.

1

The French Design Model

The designer (and design team) will capture the needs, provide analysis, and produce a statement of the problem. The conceptual design will generate a variety of solutions to the problem. This brings together the elements of engineering, science, practical knowledge, production methods, and practices. Embodiment of schemes step produces a concrete working drawing (or item) from the abstract concept. The detailing step consolidates and coordinates the fine points of producing a product. The designer of a new product is responsible for taking the initial concept to final launch. in this effort, the designer will be part of a team. The project manager, product manager, or general manager for a new product or new design team (which includes marketing, sales, operations, design, and finance) will need to manage the process.

Design for X (DFX)

Design for X (DFX) is defined as a knowledge-based approach for designing products to have as many desirable characteristics as possible. The desirable characteristics include: quality, reliability, serviceability, safety, user friendliness, etc. This approach goes beyond the traditional quality aspects of function, features, and appearance of the item. AT&T Bell Laboratories coined the term DFX to describe the process of designing a product to meet the above characteristics. In doing so, the life cycle cost of a product and the lowering of downstream manufacturing costs would be addressed. The DFX toolbox has continued to grow in number from its inception  to include hundreds of tools today. The user can be overwhelmed by the choices available. Some researchers in DFX technology have developed sophisticated models and algorithms. The usual practice is to apply one DFX tool at a time. Multiple applications of DFX tools can be costly. The authors note that a systematic framework is not yet available for use for DFX methodology. A set methodology would aid in the following ways:

  • Understanding how DFX works
  • Aiding in the selection of a tool
  • Faster learning of DFX tools
  • Providing a platform for multiple DFX tools

Usage of DFX Techniques and Tools

  1. Design guidelines:
    DFX methods are usually presented as rules of thumb (design guidelines). These rules of thumb provide broad design rules and strategies. The design rule to increase assembly efficiency requires a reduction in the part count and part types. The strategy would be to verify that each part is needed.
  2. DFX analysis tools:
    Each DFX tool involves some analytical procedure that measures the effectiveness of the selected tool. For example a DFA (design for assembly) procedure addresses the handling time, insertion time, total assembly time, number of parts, and the assembly efficiency. Each tool should have some method of verifying its effectiveness.
  3. Determine DFX tool structure:
    A technique may require other calculations before the technique can be considered complete. An independent tool will not depend on the output of another tool. The handling analysis, insertion analysis, and number of parts are all capable of being calculated, but the total assembly time requires sub- system times for each component.
  4. Tool effectiveness and context:
    Each tool can be evaluated for usefulness by the user. The tool may be evaluated based on accuracy of analysis, reliability characteristics and/or integrity of the information generated.
  5. The focus of activity and the product development process:
    If the product development process is understood by the design team, the use of the DFX tools will be of benefit. Understanding the process activities will help determine when a particular tool can be used.
  6. Mapping tool focus by level:
    The mapping of a tool by level implies that DFX analysis can be complex. Several levels of analysis may be involved with one individual tool. The structure may dictate the feasibility of tool use. For routine product redesigns, the amount of information needed may already be available. For original designs, the amount of interdependence of tools can make it difficult to coordinate all of the changes downstream.

DFX Characteristics

The following characteristics and attributes should be considered by DFX projects.

  1. Function and performance:  These factors are vital for the product.
  2. Safety: Design for safety requires the elimination of potential failure prone elements that could occur in the operation and use of the product. The design should make the product safe for: manufacture, sale, use by the consumer, and disposal.
  3. Quality: The three characteristics of quality, reliability, and durability are required and are often grouped together in this category.
  4. Reliability: A reliable design has already anticipated all that can go wrong with the product, using the laws of probability to predict product failure. Techniques are employed to reduce failure rates in design testing. FMEA techniques consider how alternative designs can fail. Derating of parts is considered. Redundancy through parallel critical component systems may be used.
  5. Testability: The performance attributes must be easily measured.
  6. Manufacturability: The concept of design for manufacturability (DFM) includes the ability to test and ship a product. Producibility and manufacturability are terms used since the 1960s. Design for manufacturability (DFM) has been the dominant term used since 1985. A design must simplify the manufacture of a product through a reduced number of parts and a reduced number of manufacturing operations.
  7. Assembly (Design for Assembly, DFA): DFA means simplifying the product so that fewer parts are involved, making the product easier to assemble. This portion of DFX can often provide the most significant benefit. A product designed for ease of assembly can: reduce service, improve recycling, reduce repair times, and ensure faster time to market. This is accomplished by using fewer parts, reducing engineering documents, lowering inventory levels, reducing inspections, minimizing setups, minimizing material handling, etc
  8. .Environment: The objective is minimal pollution during manufacture, use, and disposal. This could be defined as Design for the Environment (DFE). The concept is to increase growth without increasing the amount of consumable resources. Some categories of environmental design practices include: recovery and reuse, disassembly, waste minimization, energy conservation, material conservation, chronic risk reduction, and accident prevention.
  9. Serviceability (Maintainability and Reparability): A product should be returned to operation and use easily after a failure. This is sometimes directly linked to maintainability.
  10. Maintainability: The product must perform satisfactorily throughout its intended life with minimal expenses. The best approach is to assure the reliability of components. There should be: reduced down time for maintenance activities; reduced user and technician time for maintenance tasks; reduced  requirements for parts; and lower costs of maintenance. Endres provides some specific methods for increasing maintainability (decreasing diagnosis and repair times): use modular construction in systems, use throw away parts (instead of parts requiring repair), use built-in testing, have parts operate in a constant failure rate mode, etc.
  11. User Friendliness or Ergonomics:  Human factors engineering must fit the product to the human user. Some guidelines to consider are: fitting the product to the user’s attributes, simplifying the user’s tasks, making controls and functions obvious, anticipating human error, providing constraints to prevent incorrect use, properly positioning locating surfaces, improving component accessibility, and identify components.
  12. Appearance (Aesthetics): Attractiveness is especially necessary for consumer products. These characteristics include: special requirements of the user, relevancy of the style, compatibility of materials and form, proportional shapes, or protection from damage in service.
  13. Packaging: The best package for the product must be considered. The size and physical  characteristics of the product are important, as are the economics of the package use. The method of packaging must be determined. Automated packaging methods are desirable.
  14. Features: Features are the accessories, options, and attachments available for a product.
  15. Time to Market: The ability to have shorter cycle times in the launch design of a product is desirable. The ability to produce the product either on time or faster than the competition is a tremendous advantage.

Robust Design and Process

Dr. Genichi Taguchi wrote that the United States has coined the term “Taguchi Methods” to describe his system of robustness for the evaluation and improvement of the product development processes. He has stated that he preferred the term “quality engineering” to describe the process. Other authors have used robust design or robust engineering  to describe the process. Any of the above mentioned terms can be used.

Robust Design Approach

1

Robust design processes are one of the more important developments in design processes in recent years. The use of robust approaches for design is a process that, when used, can produce extremely reliable designs both during manufacture and in use. Robust design uses the concept of parameter control to place the design in a position where random “noise” does not cause failure. The concept is that a product or process is controlled by a number of factors to produce the desired response. The signal factor is the signal used for the intended response. That is, the actions taken (signal) to start the lawn mower (response) or the dial setting (signal) to obtain a furnace temperature (response). The success of obtaining the response is dependent on control factors and noise factors.

A Robust Design Schematic

Control factors are those parameters that are controllable by the designer. These  factors are the items in the product or process that operate to produce a response when triggered by a signal. For instance, in the case of the furnace, the control factors might be the design of the thermocouple and heat controller. Control factors are sometimes separated into those which add no cost to the product or process and those that do add cost. Since factors that add cost are frequently associated with selection of the tolerance of the components, these are called tolerance factors. Factors that don’t add cost are simply control factors. Noise factors are parameters or events that are not controllable by the designer. These are generally random, in that only the mean and variance can be predicted.
Examples of noise factors in furnace design include:

  • Line voltage variations
  • Outside temperature
  • Parallax errors in dial setting

These noise factors have the ability to produce an error in the desired response. The function of the designer is to select control factors so that the impact of noise factors on the response is minimized while maximizing the response to signal factors. This adjustment of factors is best done using statistical design of experiments or SDE.

 Some of the key principles are concept design, parameter design, and tolerance design.

  1. Concept Design

    Concept design is the selection of the process or product architecture based on technology, cost, customer, or other important considerations. This step depends  heavily on the abilities and creativity of the designer.

  2. Parameter Design

    During the parameter design stage the design is established using the lowest cost components and manufacturing techniques. The response is then optimized for control and minimized for noise. If the design meets the requirements, the designer has achieved an acceptable design at the lowest cost.

  3. Tolerance Design

    If the design doesn’t meet requirements, the designer begins considerations of more expensive components or processes that reduce the tolerances. The tolerances are reduced until the design requirements are met. With robust design approaches, the designer has the ability to produce a design with either the lowest cost, the highest reliability or an optimized combination of cost and reliability.

Example of Robust Design:

A mid-size tile manufacturing company in Japan in 1953 was having a serious problem with their $2 million kiln purchased from West Germany. The problem was extreme variation in the dimensions of the tile produced. The stacked tiles were baked inside a tunnel kiln as shown below. Tiles toward the outside of the stack tended to have a different average dimension and exhibited more variation than those toward the inside of the stack.

1A Schematic of a Tile Tunnel Kiln

The cause of variation was readily understandable. . There was an uneven temperature profile inside the kiln. To correct the cause, the company would have to redesign the kiln, which was a very  expensive proposition. This company’s budget didn’t allow such costly action, but the kiln was creating a tremendous financial loss for the company, so something had to be done. Although temperature was an important factor, it was treated as a noise factor. This meant that temperature was a necessary evil and all other factors would be varied to see if the dimensional variation could be made insensitive to temperature. In Dr. Taguchi’s words, “whether the robustness of the tile design could be improved.” People (the engineers, chemists, etc.) having knowledge about the process were brought together. They brainstormed and identified seven major controllable factors which they thought could affect the tile dimension. These were: (1) limestone content in the raw mix, (2) fineness of the additives, (3) amalgamate content, (4) type of amalgamate, (5) raw material quantity, (6) waste return content, and (7) type of feldspar.

After testing these factors over specified levels using an orthogonal design, the  experimenters discovered that factor #1 (limestone content) was the most significant factor, although other factors had smaller effects. It was found that by increasing the limestone content from 1% to 2% (and by choosing a slightly better level for other factors), the percent warpage could be reduced from 30% to less than 1%. Fortunately, limestone was the cheapest material in the tile mix. Moreover, they found through the experimentation that they could use a smaller amount of amalgamate without adversely affecting the tile dimension. Amalgamate was the most expensive material in the tile. This is a classic example of improving quality (reducing the impact ofa noise factor), reducing cost (using less amalgamate) and drastically reducing the number of defectives at the same time.

Functional Requirements

In the development of a new product, the product planning department must* determine the functions required. The designer (or design engineer) will have a set of requirements that a new product must possess. The designer will develop various concepts, embodiments, or systems that will satisfy the customer’s  requirements. All possible alternative systems should be considered. The alternative systems include existing ones and new not-yet-developed systems. The criteria for selection of a design will be based on the quality level and development costs that will enable
the product to survive in the highly competitive marketplace. The product design must be “functionally robust,” which implies that it must withstand variation in input conditions and still achieve desired performance capabilities. The designer has two objectives:

  1. Develop a product that can perform the desired functions and be robust under various operating or exposure conditions
  2. Have the product manufactured at the lowest possible cost

After selection of the new system, the nominal values and tolerance parameters of the new system must be determined. The optimal solution to the new system is called the “optimal condition” or “optimal design.”

Parameter Design

Parameter designs improve the functional robustness of the process so that the desired dimensions or quality characteristics are obtained. The process is considered functionally robust if it produces the desired part with a wide variety of part dimensions.
The steps to obtain this robustness are:

  1. Determine the signal factors (input signals) and the uncontrollable noise factors (error factors) and ranges.
  2. Choose as many controllable factors as possible, select levels for these factors, and assign these levels to appropriate orthogonal arrays. Controllable factors can be adjusted to different levels to improve the functional robustness of the process.
  3. Calculate S/N ratios from the experimental data. 1
    Where:
    r is a measurement of the magnitude of the input signals
    Sβ is the sum of squares of the ideal function (useful part)
    Ve is the mean square of nonlinearity
    VN is an error term of nonlinearity and linearity
  4. Determine the optimal conditions for the process. The optimal conditions are derived from the experimental data. The maximum average S/N of each level of controllable factors will be used for the optimal settings. Additional experiments will be conducted for verification of the settings.
  5. Conduct actual production runs.

 Signal-to-Noise Ratio

A signal-to-noise ratio (SIN) is used to evaluate system performance. In assessing the result of experiments, the S/N ratio is calculated at each design point. The combinations of the design variables that maximize the SIN ratio are selected for consideration as product or process parameter settings.

1
1
1

There are 3 cases of S/N ratios:
Case 1: S/N ratio for “smaller is better” used for minimizing the wear, shrinkage, deterioration, etc. of a product or process.
SIN = -10 log (mean-squared response)
Some references use “r” instead of “n” in the equations for Case 1 and Case 2.
Case 2: S/N ratio for “larger is better”:
SIN = -10 log (mean-squared of the reciprocal response)
In this case, S/N ratios will seek the highest values for items like strength, life, fuel efficiency, etc.
Case 3: S/N ratio for “nominal is best”:
This SIN ratio is applicable for dimensions, clearances, weights, viscosities, etc.

Parameter Design Case Study

1

A case study is taken  to illustrate the parameter design approach. An experiment was conducted to find an assembly method to join an elastomer connector to a nylon tube for use in automotive engine components. The objective was to minimize the assembly effort. There are 4 controllable factors and 3 noise factors. The controllable factors are at 3 levels; the noise factors at 2 levels. This is illustrated in Table below

Parameter Design Case Study Factors

Given 4 factors at 3 levels, this would amount to 81 experiments. Taguchi provided orthogonal arrays to reduce the amount of testing required. They are fractional factorial experiments without regard for interactions, in most cases. An L9 array can be used for the controllable factors with 9 experimental runs. The 3 noise factors are placed in an L8 array. There are 8 runs of noise conditions. This array induces noise into the experiment to help identify the controllable factors that are least sensitive to a change in noise level.

1

The two arrays are combined to form the complete parameter design layout. The L9 array is called the inner array, while the L8 array is the outer array.Example Orthogonal Design Layout

The completed matrix contains the mean response results. In addition, the variation of the signal-to-noise (S/N) ratio has been determined. The larger the S/N ratio the better. SIN ratios are computed for each of the 9 experimental conditions. An ANOVA can also be used in the calculations to supplement the S/N ratios. Taguchi prefers to use graphing techniques to visually identify the significant factors, without using ANOVA. The optimum combination of factors and levels can be determined from the analysis. A confirmation run should be conducted to verify the results.

The Loss Function

1

The loss function is used to, determine the financial loss that will occur when a quality characteristic, y, deviates from the target value, m. The quality loss is zero when the quality characteristic, y, is at the target value, m. The quality loss function is defined as the mean square deviation of the objective characteristics from their target values. The function is depicted as:
The function L(y) shows that the further the quality characteristic is away from the target, the greater the quality loss. Of course, at a value outside the tolerance specifications, the product is a defective.
The “A” value is the cost due to a defective product. The amount of deviation from the target, or “tolerance” as Taguchi calls it, is the delta (A) value. The constant k is derived as shown.  The mean square deviation from the target (σ2), as used by Taguchi, does not indicate a variance.

Example of  the Loss Function

 Given that Mr X wished to buy a pair of size 7 shoes. The store was out of size 7 and he had to settle for a pair of 7 and a half (7.5) shoes. After 2 days, he found them to be ill-fitting and had to discard them. The original cost of the shoes was $50. Size 6.5 shoes were also not suitable. The quality loss function can be applied to this situation.

1
1

The target value m is 7.0
The existing quality characteristic y is 7.5
The cost of a defective product A is $50.
The hypothetical tolerance (7.5 – 7.0) is 0.5
Solving for the quality loss function:
The above calculations shows the quality loss to be $50. If the shoe size were 7.25, and keeping the other variables the same, the resulting loss to society would be:This quality loss calculation indicates a loss to society of $12.50. The use of the loss function illustrates that there is value in reducing variation in the product.

Tolerance Design

1

The tolerances for all system components must be determined. This includes the  types of materials used. In tolerance design, there is a balance between a given quality level and cost of the design. The measurement criteria is quality losses. Quality losses are estimated by the functional deviation of the products from their target values plus the cost due to the malfunction of these products. Taguchi  described the approach as using economical safety factors. For a manufacturer, without design responsibility, tolerances will be supplied by its customers. Design responsible indicates that the organization has the authority to change and produce design drawings. Tolerances are usually established by using engineering experience, considering the uncertainty of design and production factors. A safety factor of 4 is typically used in the United States. This safety factor is bound to vary across industry. The defense and communications sectors may require much larger values. The shipping specifications for a product characteristic is said to be on a higher-level in relation to the subsystem and parts. The subsystem characteristic values are also on a higher level in relation to its parts and materials. The functional limit Δ0 must be determined by methods like experimentation and testing. Taguchi uses a LD50 point as a guide to establish the upper and lower functional limits. The LD50 point is where the product will fail 50% of the time. The 50% point is called the median.  An example from Taguchi illustrates the determination of the functional limit:
A spark plug has a nominal ignition voltage of 20 kV. The lower functional limit Δ01, is -12 kV. The upper functional limit Δ02 is +18 kV. These values are determined by testing. The resulting specifications will have a lower tolerance (Δ01) of 8kV and upper tolerance (Δ01) of 38 kV. The relationships between the tolerance specification, the functional limit, and the safety factor are as follows:

1
1
1

The economical safety factor φ is determined as follows:
Given the value of the quality characteristic at y, and the target value at m, the quality loss function will appear as follows:
For example A power supply for a TV set has the functional limits at +/- 25% of output voltage. The average quality loss A0 after shipment of a bad TV is known to be $300. The adjustment of a power supply in-house before shipping is $1.00.  The economical safety factor φ  is calculated as:

1

The tolerance specification for the output voltage, as a percentage, will be:
Therefore, the tolerance specification for the output voltage of 120 volts will be:

120±(120)(0.0145) = 120 ±  1.74 volts

Although the functional limits were initially established at 120 ±30 volts(25%), the TV sets should have output voltages within 1.74 volts of the nominal.

Taguchi’s Quality Imperatives

  • Robustness is a function of product design. The manufacturing process and on-line quality control cannot do much to change that. Quality losses are a loss to society.
  • Robust products have a strong signal with low internal noise. The design change of increasing the signal-to-noise ratio will improve the robustness of the product.
  • For new products, use planned experiments varying in values, stresses, and conditions to seek out the parameter targets.  Orthogonal arrays are recommended.
  • To build robust products, simulate customer-use conditions.
  • Tolerances are set before going to manufacturing. The quality loss function _ can be measured.
  • Products that barely meet the standard are only slightly better than products that fail the specifications. The aim is for the target value.
  • The factory must manufacture products that are consistent. Reduced variation is needed for consistency.
  • Reducing product failure in the field will reduce the number of defectives in the factory. Part variation reduction decreases system variation.
  • Proposals for capital equipment for on-line quality efforts should have the average quality loss (quality loss function) added to the proposal.

The use of engineering techniques using robust design will improve customer satisfaction, reduce costs, and shorten the development time. The reduction of rework in the development process will get the product to market quicker, and smoother.

Statistical Tolerancing

Statistical tolerancing uses the square root of the sum of variances to determine the tolerances required, when two or more components are assembled. This results in tighter tolerances for the assembly than would be indicated by summing the individual tolerances.
Example: The assignment of tolerances involves many factors including the sigma safety level required. Let’s assume that plus and minus four sigma is necessary and that three components are assembled.One might incorrectly assume that the dimensions of the final assembly would be 30″ ± 0.014″. The nominal thickness is correct, but the variation is incorrect. There are two important forces at work here: random assembly and a normal distribution of variation in each of the parts. The proper tolerance is determined by the additive law of variances. (Variance equals σ2 ).
Thus:Therefore:
The final assembly, without special effort, will be: 30″ ±  0.0082″
Compare ± 0.014″ there is a 41% improvement(±  0.0082″). Consider the implications of this difference on the final product and the potential for unnecessary internal  scrap.

Porter’s Five Competitive Forces

Professor Michael Porter of the Harvard Business School developed the five competitive forces as a strategy to analyze the marketplace and to gain a market advantage. He states that a company’s current position is the heart of strategy. The five forces affect most industries. An analyst may have to perform considerable research in order to determine the positioning of any individual company. The five competitive forces are:

  1. The threat of new entrants
  2. The power of suppliers
  3. The power of customers
  4. Substitute products or services
  5. Industry rivalry
  1. The Threat of New Entrants

    The ability of a new competitor to enter into an industrial sector is a major market force that existing companies have to consider. If the barriers are not too difficult, new competitors will bring additional capacity, new or greater resources, and the desire to gain market share. There are six possible barriers to consider:

    1. Economies of scale: The new entrant must be prepared to compete on a large scale. The economies of scale requires very good operational techniques
    2. Product differentiation: If tremendous brand loyalty is a barrier, this may cause new entrants to invest very heavily in methods to counter brand loyalty.
    3. Capital requirements: Large initial investments may be required in facilities inventory, marketing, or R&D in order to compete.
    4. Learning curve advantage: A cost advantage may occur from being further down the learning curve. This advantage is due to elements like accumulated production experience or patents.
    5. Access to distribution channels: Market distribution of the product must be secured in some fashion. The existing distribution channels may be closed or open to new entrants.
    6. Government policy: Regulated industries enjoy some protection from new competitors. Examples include some airlines, coal mining companies, and liquor retailers.
  2. The Power of Suppliers

    Suppliers and customers (buyers) can be considered to be on opposing economic sides. Industrial profits can be affected by the two vying forces if there is an imbalance between them. Some of the factors that make a supplier a powerful force, and potentially difficult to bargain with, include:

    • The industry is dominated by a few companies
    • The supplier has a product or raw material that is unique
    • The product does not have substitutes
    • The supplier has the potential to perform or integrate the service
    • The industry is not important to the supplier
  3. The Power of Customers

    Customers (buyers) are powerful if:

    • Economies of scale matter, and purchases are large
    • The buyer can integrate backwards if needed, keeping costs down
    • The purchased product is a small part of the buyer’s total cost
    • The buyer is in a low profit industry, and must pursue low cost items
    • The product is deemed a commodity
  4. Substitute Products

    A product or industry that has a substitute product will find itself with a cap on potential profits. This can be seen in steel versus aluminum products, corn syrup versus sugar, or fiberglass versus Styrofoam products. Substitute products may be new technologies that have the potential to cause price reductions in the industry.

  5. Industry Rivalry 

    The jockeying among current contestants can be an important factor especially when the rivalry among industry foes is intense. There can be significant price competition, frequent product introductions, and industrial advertising wars. Industry rivalry will have the following characteristics:

    • There are numerous competitors with equal shares
    • There is slow industry growth
    • The product is not easily differentiated (a commodity)
    • There is excessive industry capacity
    • The exit barriers are high (the costs of leaving the industry are very high)
    •  There is intense rivalry
Use of the Five Competitive Forces

An analysis of the five competitive forces may require considerable effort. Professor Porter presents an organized framework to perform the analysis. Once the forces  are identified, an analyst can determine the strengths and weaknesses of a company as it pursues a particular strategy. The company can try to match up its strengths and weaknesses to the current industry model. That is, if the company is not the low cost producer, it will not try to have a price war with the industry’s low cost producer, unless it has long staying power. The company might also try to position itself in a quadrant where the forces are weakest, and where higher profit opportunities might exist. Porter maintains that an effective competitive strategy will allow a company to be proactive in its actions toward creating a defendable position against competition. The company can position itself in a certain segment buffeted by its capabilities and resources. It can also try to reduce or influence certain competitive forces in the industry. Finally, the analysis can help the company anticipate shifts in the underlying forces and to take advantage of business opportunities.NA

Portfolio Architecting

Technical processes include technology portfolio architecting, research and technology development (R&TD), product commercialization, and post-launch engineering work. The older approach used DMAIC six sigma and lean methods to correct problems and increase flow in existing technical processes, which provided quick, “emergency” actions. The new approach involves enabling and enhancing technical processes to prevent problems before they become an issue. This uses  six sigma on a sustained basis to become consistent and predictable at conducting value-adding tasks. Inbound R&TD is focused on strategic technology portfolio definition, development, optimization, and transfer. Inbound product design engineering is focused on tactical product commercialization to rapidly prepare a new design, which often possesses transferred, new technology to fulfill launch requirements. Outbound post-launch engineering is focused on operations in post-launch production and service engineering support. Service engineering professionals often function as a “reactionary force” to fix problems. Instead, the focus should be on planning engineering changes and upgrades to increase profit margins. Newly transferred technology is frequently immature resulting in a delay in the delivery of new products. Executives want an orderly design and launch of new product lines. If the product portfolio and technology needed to enable it are not linked and timed for integration, the work of executing the new portfolio cannot happen on time. There is a need to design a strong, strategic alignment between product and technology portfolio architecting tasks for the sake of downstream % cycle-time efficiency and control. The product and technology portfolio renewal process is the first of two strategic processes in which research and development (R&D) professionals can use six sigma methods. The second process is the formal development of new technologies that the product and technology portfolio process requires. 

Strategic to Tactical Workflow

1

The strategic component consists of the inbound technical processes, research and technology development; and the tactical component is product design engineering done during commercialization.
Figure below shows the integrated marketing and technical functions that reside within the inbound and outbound technical areas.

Process Linkage Diagram

To enable growth, marketing and technical processes and functions must be linked for six sigma in marketing, R&TD, and design. Integrated, multi-functional teams from inbound marketing, R&TD, design, and production/service support engineering  must be used across all three process areas to develop and share data, to manage risk and to make decisions. The lDEA process for product portfolio definition and development consists of the following phases: 

  • Identify markets, their segments, and opportunities using technology benchmarking and road mapping
  • Define portfolio requirements and product architectural alternatives
  • Evaluate product alternatives against competitive portfolios, then select
  • Activate ranked and resourced individual product commercialization projects

With statistically significant data, differentiated needs between the market segments within the general markets may be defined. Diverse new, unique, and difficult (NUD) needs may be translated into a set of product portfolio requirements that possess common and differentiated targets and fulfillment ranges. These requirements drive the product portfolio architecting process. Innovation at this level is the most strategic form of creativity and idea generation that a company can conduct. The define phase is the key transfer point for delivering product portfolio requirements to the R&TD organization. R&TD receives these diverse requirements and translates them into technology requirements. With several alternative product portfolio architectures defined, the team enters the , evaluate phase. This phase involves the data-driven evaluation of the candidate portfolio architectures against competitive benchmarks in light of the portfolio requirements. A superior hybrid portfolio architecture emerges from this process phase. The final phase of P&TPR is to activate product commercialization projects out of the superior portfolio architecture. The focus here is on activating projects that will, in the first phase of commercialization, convert opportunities into specific product requirements and ideas into specific product concepts.

Set-Based Design

Set-based concurrent engineering (SBCE) design begins with broad sets of possible solutions, converging to a narrow set of alternatives and then to a final solution. Design teams from various functions can work sets of solutions in parallel, gradually narrowing sets of solutions. Information from development, testing, customers, and others will help narrow the decision sets. Sets of ideas are viewed and reworked leading to more robust, optimized, and efficient projects. This approach is deemed to be more efficient than working with one idea at a time. An analogy to set-based concurrent design is the 20 questions game. A player will be asked to identify an unknown object or problem. The player trying to seek the answer will have only 20 questions to ask. The experienced player will use a series of broad questions to narrow the scope of the field of possibilities. Questions that define animal, vegetable, or mineral will eliminate quite a few possibilities quickly. SBCE seeks to narrow the scope of design in a more efficient and robust manner. Toyota is the only company using practices consistent with SBCE. SBCE assumes that reasoning and communicating about sets of ideas is preferable to working with one idea at a time.

Principles of SBCE

  1. Define the feasible regions
  2.  Communicate sets of possibilities
  3.  Look for intersections
  4. Explore trade-offs by designing multiple alternatives
  5. Impose minimum constraint
  6. Narrow sets smoothly, balancing the need to learn and the need to decide
  7. Pursue high-risk and conservative options in parallel
  8. Establish feasibility before commitment
  9. Stay within sets once committed
  10. Control by managing uncertainty at process gates
  11. Seek solutions robust to physical, market, and design variation

Theory of Inventive Problem-Solving (TRIZ)

TRIZ is a Russian abbreviation for “the theory of inventive problem solving.”. Altshuller states that inventiveness can be taught. Creativity can be learned, it is not innate, one does not have to be born with it. Altshuller asserts that traditional inventing is “trial and error” resulting in much wasted time, effort, and resources. Through his years of education and imprisonment, he solidified a theory that one solves problems through a collection of assembled techniques. Technical evolution and invention have certain patterns. One should be knowledgeable with them to solve technical problems. There is some common sense, logic, and use of physics in problem solving.
There are three groups of methods to solve technical problems:

  1. Various tricks (a reference to a technique)
  2. Methods based on utilizing physical effects and phenomena (changing the  state of the physical properties of substances)
  3. Complex methods (combination of tricks and physics)

Altshuller provides an introduction to ARIZ (algorithm to solve an inventive problem). This is a sequence of 9 action steps in the use of TRIZ. The steps are:

  • Analysis of the problem
  • Analysis of the problem’s model: Use of a block diagram defining the “operating zone”
  • Formulation of the ideal final result (IFR): Providing a description of the final result, which will provide more details
  • Utilization of outside substances and field resources
  • Utilization of an informational data bank: Determining the physical or chemical constraints (standards) of the problem
  • Change or reformulate the problem .
  • Analysis of the method that removed the physical contradiction: Is a quality solution provided?
  • Utilization of the found solution: Seeking side effects of the solution on the system or other processes
  • Analysis of the steps that lead to the solution: An analysis may prove useful later

Initially, there were 27 TRIZ tools  which were later expanded to 40 innovative, technical tools. The list of the 40 principles is:

  • Segmentation
  • Partial or excessive action
  • Extraction
  • Transition into a new dimension
  • Local quality
  • Mechanical vibration
  •  Asymmetry
  • Periodic action
  • Consolidation
  • Continuity of useful action
  • Universality
  • Rushing through
  • Nesting
  • Convert harm into benefit
  •  Counterweight
  • Replacement of mechanical systems
  • Prior counteraction
  • Pneumatic or hydraulic construction
  •  Prior action
  • Flexible membranes or thin films
  • Cushion in advance
  • Porous material
  • Equipotentiality
  • Changing the color
  • Do it in reverse
  • Homogeneity
  •  Feedback
  • Rejecting or regenerating parts
  • Mediator
  • Transformation of properties
  • Self-service
  • Phase transition
  • Copying
  • Thermal expansion
  • Dispose
  • Accelerated oxidation
  • Spheroidality
  • Inert environment
  • Dynamicity
  • Composite materials

Systematic Design

Systematic design is a step-by-step approach to design. It provides a structure to the design process using a German methodology. It is stated that systematic design is a very rational approach and will produce valid solutions. The authors who describe this approach detail a method that is close to the guidelines as written by the German design standard: Guideline VDI 2221 (“Systematic Approach to the Design of Technical Systems and Products” through the Design Committee of the VDI: Verein Deutscher Ingenieure).
Pahl  presents four main phases in the design process:

  • Task clarification: collect information, formulate concepts, identify needs
  • Conceptual design: identify essential problems and sub-functions
  • Embodiment design: develop concepts, layouts, refinements
  • Detail design: finalize drawings, concepts and generate documentation

An abstract concept is developed into a concrete item, represented by a drawing. Synthesis involves search and discovery, and the act of combining parts or elements to produce a new form. Modern German design thinking uses the following structure:

  • The requirements of the design are determined
  • The appropriate process elements are selected
  • A step-by-step method transforms qualitative items to quantitative items
  • A deliberate combination of elements of differing complexities is used

The main steps in the conceptual phase:

  • Clarify the task
  • Identify essential problems
  • Establish function structures
  • Search for solutions using intuition and brainstorming
  • Combine solution principles and select qualitatively
  •  Firm up concept variants: preliminary calculations, and layouts
  • Evaluate concept variants

There are suggested tools and methods for various steps along the design process. The creativity of the designer is encouraged in this method, but on a more structured basis. Any and all design methods must employ the designer’s creativity to find new innovative solutions.

Critical Parameter Management

Critical parameter management (CPM) is a:

  • Disciplined methodology for managing, analyzing, and reporting technical  product performance.
  • Process for linking system parameters for i ‘sensitivity analysis and optimization of critical performance factors.
  • Strategic tool for improving product development by integrating systems, software, design, and manufacturing activities.

CPM program benefits include:

  1. Facilitated analysis
    • Statistical modeling & optimization of the performance-cost trade-off
    • Real-time system-level sensitivity analysis
    • Connects analyses between system, subsystem and component levels
  2. Improved collaboration
    • Shares technical analysis and knowledge
    • Links ownership to parameters
    • Connects teams and parameters to understand flow-down of requirements
    • Captures and leverages invested intellectual capital for future business
  3. Streamlined reporting
    • Total Property Management (TPM) design margins are statistically tracked over product lifecycle
    • Automated, real-time TPM data gathering I report generation
    • Reconciliation of requirement allocation and engineering design capability

The proper place to initiate critical parameter management in a business is during advanced product portfolio planning, and research and technology development (R&TD). At these earliest stages of product development, a certified portfolio of critical functional parameters and responses can be rapidly transferred as a family of modular designs in the product commercialization program. Critical parameter management is a systems-engineering and integration process that is used within an overarching technology development and product commercialization roadmap. The I2DOV road map defines a generic technology development process approach to research and technology development which consists of the following phases:

  •  I2 = Invention and Innovation
  • D = Develop technology
  • O = Optimization of the robustness of the baseline technologies
  • V = Verification of the platform or sublevel technologies

Critical parameter management derives from a carefully defined architectural flow down of requirements that can be directly linked to functions that are engineered to flow up to fulfill the requirements,  Customer needs drive system-level technical requirements, which drive the system-level engineering functions, which in turn, drive the definition of the system-level architectural concepts. When a system architecture is estimated from this perspective, the inevitable trade-offs due to subsystem, subassembly, and component architectures begin.

1

Critical Parameter Management Model

Pugh Analysis

Stuart Pugh, former Professor of Engineering Design, University of Strathclyde, Glasgow, Scotland, (now deceased) was a leader in product development (total design) methodology. He was a practicing engineer in industry before turning to the academic world. His work provides a methodology for product conception and generation.  Quality function deployment can be used to determine customer technical requirements. This provides the starting point necessary to develop new products. Pugh suggests a cross functional team activity to assist in the development of improved concepts. The process starts with a set of alternative designs. These
early designs come from various individuals in response to the initial project charter. A matrix-based process is used to refine the concepts. During the selection process, additional new concepts are generated. The final concept will generally not be the original concept.
The Pugh concept selection process has 10 steps: .

  1. Choose criteria: The criteria comes from the technical requirements.
  2. Form the matrix: An example matrix is shown below.
  3. Clarify the concepts: The team members must be sure that all of the concepts are understood. New concepts may require a sketch for visualization.
  4. Choose the datum concept: Select a design that is among the best concepts available for the baseline (datum).
  5. Run the matrix: Comparisons are made on every concept compared to the datum. Use a simple scale to rate the concepts. “A+” can be used for a better concept. “A-” for a worse design, and a “s” for a same design.
  6. Evaluate the ratings: Add up the scores for each category. See what the positives will contribute to one’s insight of the design.
  7. Attack the negatives and enhance the positives: Actively discuss the most promising concepts. Kill or modify the negative ones.
  8. Select a new datum and rerun the matrix: A new, hybrid can be entered into the matrix for consideration.
  9. Plan further work: At the end of the first working session, the team may gather more information, perform experiments, seek technical knowledge, etc.
  10. Iterate to arrive at a new winning concept: Return the team to work on the concepts. Rerun the matrix for further analysis as needed.
1

Example of a Pugh Evaluation Matrix

The Pugh concept selection method has proven to be successful in the product  development process. The team will acquire:

  • Better insight on the requirements
  • Better understanding of the design problems
  • Greater understanding of the potential solutions
  • Greater understanding of the iteration of concepts
  • More insight on why certain designs are stronger than others
  • The desire to create additional concepts

Back to Home Page

Design of Experiments

Design of experiments (DOE) is used to understand the effects of the factors and interactions that impact the output of a process. As a battery of tests, a DOE is designed to methodically build understanding and enhance the predictability of a process. A DOE investigates a list of potential factors whose variation might impact the process output. These factors can be derived from a variety of sources including process maps, FMEAs, Multi-Vari studies, Fishbone Diagrams, brainstorming techniques, and Cause and Effect Matrices. With most data-analysis methods, you observe what happens in a process without intervening. With a designed experiment, you change the process settings to see the effect this has on the process output. The term design of experiments refers to the structured way you change these settings so that you can study the effects of changing multiple settings simultaneously. This active approach allows you to effectively and efficiently explore the relationship between multiple process variables (x’s) and the output, or process performance variables (y’s). This tool is most commonly used in the Analyze step of the DMAIC method as an aid in identifying and quantifying the key drivers of variation, and in the Improve step as an aid in selecting the most effective solutions from a long list of possibilities.

Introduction

  • DOE identifies the “vital few” sources of variation (x’s)—the factors that have the biggest impact on the results
  •  DOE identifies the x’s that have little effect on the results
  • It quantifies the effects of the important x’s, including their interactions
  • It produces an equation that quantifies the relationship between the x’s and the y’s
  • It predicts how much gain or loss will result from changes in process conditions

The types of DOEs include:

  • Screening DOEs, which ignore most of the higher order interaction effects so that the team can reduce the candidate factors down to the most important ones.
  • Characterization DOEs, which evaluate main factors and interactions to provide a prediction equation. These equations can range from 2k designs up to general linear models with multiple factors at multiple levels. Some software packages readily evaluate nonlinear effects using center points and also allow for the use of blocking in 2k analyses.
  •  Optimizing DOEs, which use more complex designs such as Response Surface Methodology or iterative simple designs such as evolutionary operation or plant experimentation to determine
    the optimum set of factors.
  • Confirming DOEs, where experiments are done to ensure that the prediction equation matches reality.

Classical experiments focus on 1FAT (one factor at a time) at two or three levels and attempt to hold everything else constant (which is impossible to do in a complicated process). When DOE is properly constructed, it can focus on a wide range of key input factors or variables and will determine the optimum levels of each of the factors. It should be recognized that the Pareto principle applies to the world of experimentation. That is, 20% of the potential input factors generally make 80% of the impact on the result.
The classical approach to experimentation, changing just one factor at a time, has shortcomings:

  • Too many experiments are necessary to study the effects of all the input factors.
  • The optimum combination of all the variables may never be revealed.
  •  The interaction (the behavior of one factor may be dependent on the level of another factor) between factors cannot be determined.
  • Unless carefully planned and the results studied statistically, conclusions may be wrong or misleading.
  • Even if the answers are not actually wrong, non-statistical experiments are often inconclusive. Many of the observed effects tend to be mysterious or unexplainable.
  • Time and effort may be wasted by studying the wrong variables or obtaining too much or too little data.

The design of experiments overcomes these problems by careful planning. In short, DOE is a methodology of varying a number of input factors simultaneously, in a carefully planned manner, such that their individual and combined effects on the output can be identified. Getting good results from a DOE involves a number of steps:

  • Set objectives
  • Select process variables
  • Select an experimental design
  • Execute the design
  • Check that the data are consistent with the experimental assumptions
  • Analyze and interpret the results
  • Use/present the results (may lead to further runs or DOES)

Applications of DOE

Situations, where experimental design can be effectively used include:

  • Choosing between alternatives
  • Selecting the key factors affecting a response
  • Response surface modeling to:
    • Hit a target
    • Reduce variability
    • Maximize or minimize a response
    • Make a process robust (despite uncontrollable “noise” factors)
    • Seek multiple goals

Advantages of DOE:

  • Many factors can be evaluated simultaneously, making the DOE process economical and less interruptive to normal operations.
  •  Sometimes factors having an important influence on the output cannot be controlled (noise factors), but other input factors can be controlled to make the output insensitive to noise factors.
  • ln-depth, statistical knowledge is not always necessary to get a big benefit from standard planned experimentation.
  •  One can look at a process with relatively few experiments. The important factors can be distinguished from the less important ones. Concentrated effort can then be directed at the important ones.
  • Since the designs are balanced, there is confidence in the conclusions drawn. The factors can usually be set at the optimum levels for verification.
  • If important factors are overlooked in an experiment, the results will indicate that they were overlooked.
  • Precise statistical analysis can be run using standard computer programs.
  • Frequently, results can be improved without additional costs (other than the ( costs associated with the trials). In many cases, tremendous cost savings can be achieved.

DOE Terms

Understanding DOEs requires an explanation of certain concepts and terms.

  1. Alias:  An alias occurs when two-factor effects are confused or confounded with each other. Alias occurs when the analysis of a factor or interaction cannot be unambiguously determined because the factor or interaction settings are identical to another factor or interaction, or is a linear combination of other factors or interactions. As a result, one might not know which factor or interaction is responsible for the change in the output value. Note that aliasing/confounding can be additive, where two or more insignificant effects add and give a false impression of statistical validity. Aliasing can also offset two important effects and essentially cancel them out.
  2. Balanced:  A fractional factorial design, in which an equal number of trials design (at every level state) is conducted for each factor. A balanced design will have an equal number of runs at each combination of the high and low settings for each factor.
  3. Block: A subdivision of the experiment into relatively homogeneous experimental units. The term is from agriculture, where a single field would be divided into blocks for different treatments.
  4. Blocking: When structuring fractional factorial experimental test trials, blocking is used to account for variables that the experimenter wishes to avoid. A block may be a dummy factor that doesn’t interact with the real factors. Blocking allows the team to study the effects of noise factors and remove any potential effects resulting from a known noise factor. For example, an experimental design may require a set of eight runs to be complete, but there is only enough raw material in a lot to perform four runs. There is a concern that different results may be obtained with the different lots of material. To prevent these differences, should they exist, from influencing the results of the experiment, the runs are divided into two halves with each being balanced and orthogonal. Thus, the DOE is done in two halves or “blocks” with “a material lot” as the blocking factor. (Because there is not enough material to run all eight experiments with one lot, some runs will have to be done with each material anyway.) The analysis will determine if there is a statistically significant difference between these two blocks. If there is no difference, the blocks can be removed from the model and the data treated as a whole. Blocking is a way of determining which trials to run with each lot so that any effect from the different material will not influence the decisions made about the effects of the factors being explored. If the blocks are significant, then the experimenter was correct in the choice of blocking factor and the noise due to the blocking factor was minimized. This may also lead to more experimentation on the blocking factor.
  5. Box-Behnken: When full, second-order, polynomial models are to be used in response surface studies of three or more factors, Box- Behnken designs are often very efficient. They are highly fractional, three-level factorial designs.
  6. Collinear: A collinear condition occurs when two variables are totally correlated. One variable must be eliminated from the analysis for valid results.
  7. Confounded: When the effects of two factors are not separable. In the following example, A, B, and C are input factors, and columns AB, AC, & BC represent interactions (multiplication of 2 factors). Confounded columns are identified by arrows, indicating the setting of one cannot be separated from the setting of the other.1
  8. Continuous and discrete factors: A DOE may use continuous and/or discrete factors. A continuous factor is one (such as feed rate) whose levels can vary continuously, while a discrete factor will have a predetermined finite number of levels (such as supplier A or supplier B). Continuous factors are needed when true curvature/center point analysis is desired.
  9. Correlation: A number between -1 and 1 that indicates the degree of linear coefficient (r) relationship between two sets of numbers. Zero (0) indicates no linear relationship.
  10. Covariates: Things that change during an experiment that had not been planned to change, such as temperature or humidity. Randomize the test order to alleviate this problem. Record the value of the covariate for possible use in regression analysis.
  11. Curvature: Refers to non-straight line behavior between one or more factors and the response. Curvature is usually expressed in mathematical terms involving the square or cube of the factor. For example, in the model:1
  12. Degrees of Freedom: The terms used are DOF, DF, df, or V. The number of measurements that are independently available for estimating a population parameter.
  13. Design of experiments: The arrangement in which an experimental program is to be conducted and the selection of the levels of one or more (DOE) factors or factor combinations to be included in the experiment. Factor levels are accessed in a balanced full or fractional factorial design. The term SDE (statistical design of experiment) is also widely used.
  14. Design Projection: The principle of design projection states that if the outcome of a fractional factorial design has insignificant terms, the insignificant terms can be removed from the model, thereby reducing the design. For example, determining the effect of four factors for a full factorial design would normally require sixteen runs (a 24 design). Because of resource limitations, only a half fraction (a 2(4-1) design) consisting of eight trials can be run. If the analysis showed that one of the main effects (and associated interactions) was insignificant, then that factor could be removed from the model and the design analyzed as a full factorial design. A half fraction has therefore become a full factorial.
  15. Efficiency: It can be that considered one estimator is more efficient than another if it had a smaller variance.
    Percentage efficiency is calculated as:1
  16. EVOP: Stands for evolutionary operation, a term that describes the way sequential experimental designs can be made to adapt to
    system behavior by learning from present results and predicting future treatments for better response. Often, small response improvements may be made via large sample sizes. The experimental risk, however, is quite low because the trials are conducted in the near vicinity of an already satisfactory process.
  17. Experiment:  A test is undertaken to make an improvement in a process, or to learn previously unknown information.
  18. Experimental error: Variation in response or outcome of virtually identical test conditions. This is also called residual error.
  19. First-order: Refers to the power to which a factor appears in a model. If “X1” represents a factor and “B” is its factor effect, then the model: Y=B0+B1X1+B2X2
    is first-order in both X1 and X2. First-order models cannot account for curvature or interaction.
  20. Fractional: An adjective that means fewer experiments than the full design calls for. The three-factor designs shown below are two-level, half-fractional designs.1
  21. Full factorial: Describes experimental designs which contain all combinations of all levels of all factors. No possible treatment combinations are omitted. A two-level, three-factor full factorial design is shown below:1
  22. Inference space: The inference space is the operating range of the factors. It is where the factor’s range is used to infer an output to a setting not used in the design. Normally, it is assumed that the settings of the factors within the minimum and maximum
    experimental settings are acceptable levels to use in a prediction equation. For example, if factor A has low and high settings of five and ten units, it is reasonable to make predictions when the factor is at a setting of six. However, predictions at a value of thirteen cannot and should not be attempted because this setting is outside the region that was explored. (For a 2k design, a check for curvature should be done prior to assuming linearity between the high and low outputs.)
  23. Narrow inference: A narrow inference utilizes a small number of test factors and/or factor levels or levels that are close together to minimize the noise in a DOE. One example of a narrow inference is having five machines, but doing a DOE on just one machine to minimize the noise variables of machines and operators.
  24. Broad inference: A broad inference utilizes a large number of the test factors and/or factor levels or levels that are far apart, recognizing that noise will be present. An example of a broad inference is performing a DOE on all five machines. There will be more noise, but the results more fully address the entire process.
  25. Input factor: An independent variable that may affect a (dependent) response variable and is included at different levels in the experiment.
  26. Inner array: In Taguchi-style fractional factorial experiments, these are the factors that can be controlled in a process.
  27. Interaction: An interaction occurs when the effect of one input factor on the output depends upon the level of another input factor. 1 
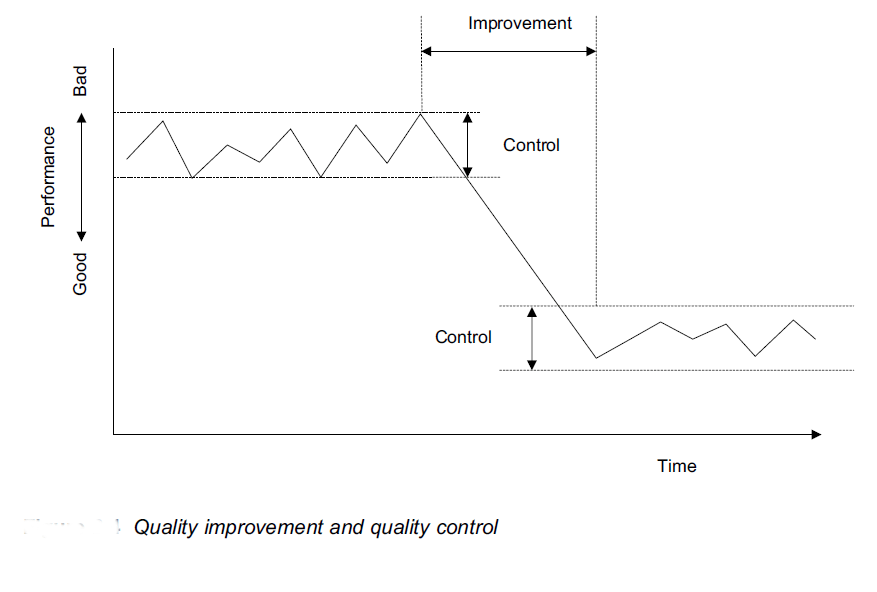
Interactions can be readily examined with full factorial experiments. Often, interactions are lost with fractional factorial experiments.
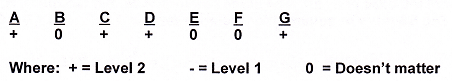
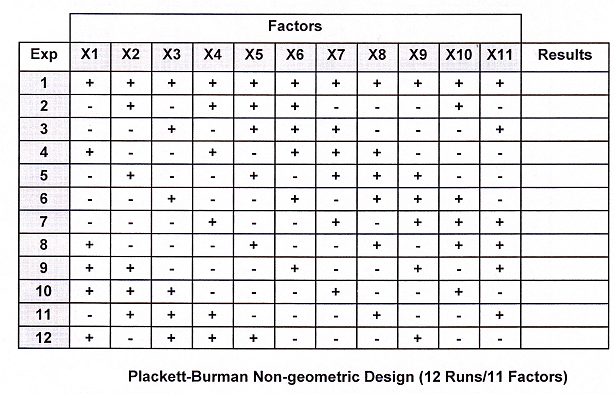
  28. Level:  A given factor or a specific setting of an input factor. Four levels of heat treatment may be 100°F, 120°F, 140°F, and 160°F.
  29. Main effect: An estimate of the effect of a factor independent of any other factors.
  30. Mixture experiments: Experiments in which the variables are expressed as proportions of the whole and sum to 1.0.
  31. Multicollinearity:  This occurs when two or more input factors are expected to independently affect the value of an output factor but are found to be highly correlated. For example, an experiment is being conducted to determine the market value of a house. The input factors are square feet of living space and the number of bedrooms. In this case, the two input factors are highly correlated. Larger residences have more bedrooms.
  32. Nested: An experimental design in which all trials are not fully experimenting randomized. There is generally a logical reason for taking this action. For example, in an experiment, technicians might be nested within labs. As long as each technician stays with the same lab, the techs are nested. It is not often that techs travel to different labs just to make the design balanced.
  33. Optimization: This involves finding the treatment combinations that give the most desired response. Optimization can be “maximization” (as, for example, in the case of product yield) or “minimization” (in the case of impurities).
  34. Orthogonal: A design is orthogonal if the main and interaction effects in a given design can be estimated without confounding the other main effects or interactions. Two columns in a design matrix are orthogonal if the sum of the products of their elements within each row is equal to zero. A full factorial is said to be balanced, or orthogonal because there is an equal number of data points under each level of each factor. When a factorial experiment is balanced, the design is said to be completely orthogonal. The Pearson correlation coefficient of all of the factor and interaction columns will be zero.
  35. Outer array: In a Taguchi-style fractional factorial experiment, these are the factors that cannot be controlled in a process.
  36. Paired comparison: The basis of a technique for treating data so as to ignore sample-to-sample variability and focus more clearly on variability caused by a specific factor effect. Only the differences in response for each sample are tested because sample-to-sample differences are irrelevant.
  37. Parallel experiments: These experiments are done at the same time, not one after another, e.g., agricultural experiments in a big cornfield. Parallel experimentation is the opposite of sequential experimentation.
  38. Precision: The closeness of agreement between test results.
  39. Qualitative: This refers to descriptors of category and/or order, but not of interval or origin. Different machines, operators, materials, etc. represent qualitative levels or treatments.
  40. Quantitative: This refers to descriptors of order and interval (interval scale) and possibly also of origin (ratio scale). As a quantitative factor, “temperature” might describe the interval value 27.32°C. As a quantitative response, “yield” might describe the ratio value 87.42%.
  41. Random factor: A random factor is any factor whose settings (such as any speed within an operating range) could be randomly selected, as opposed to a fixed factor whose settings (such as the current and proposed levels) are those of specific interest to the experimenter. Fixed factors are used when an organization wishes to investigate the effects of particular settings or, at most, the inference space enclosed by them. Random factors are used when the organization wishes to draw conclusions about the entire population of levels.
  42. Randomization: Randomization is a technique to distribute the effect of unknown noise variables over all the factors. Because some noise factors may change over time, any factors whose settings are not randomized could be confounded with these time-dependent elements. Examples of factors that change over time are tool wear, operator fatigue, process bath concentrations, and changing temperatures throughout the day.
  43. Randomized trials: Frees an experiment from the environment and eliminates biases. This technique avoids the undue influences of systematic changes that are known or unknown.
  44. Repeated trials: Trials that are conducted to estimate the pure trial-to-trial experimental error so that lack of fit may be judged. Also called replications.
  45. Residual error: The difference between the observed and the predicted value (ε) or (E) for that result, based on an empirically determined model. It can be variation in outcomes of virtually identical test conditions.
  46. Residual: The difference between experimental responses and predicted model values. A residual is a measure of the error in a model. A prediction equation estimates the output of a process at various levels within the inference space. These predicted values are called fits. The residual is the difference between a fit and an actual experimentally observed data point.
  47. Residual Analysis:  Residual analysis is the graphical analysis of residuals to determine if a pattern can be detected. If the prediction equation is a good model, the residuals will be independently and normally distributed with a mean of zero and a constant variance. Nonrandom patterns indicate that the underlying assumptions for the use of ANOVA have not been met. It is important to look for nonrandom and/or non-normal patterns in the residuals. These types of patterns can often point to potential solutions. For example, if the residuals have more than one mode, there is most likely a missing factor. If the residuals show trends or patterns vs. the run order, there is a time-linked factor.
  48. Resolution: Resolution is the amount and structure of aliasing of factors and interactions in an experimental design. Roman numerals are used to indicate the degree of aliasing, with Resolution III being the most confounded. A full factorial design has no terms that are aliased. The numeral indicates the aliasing pattern. A Resolution III has main effects and two-way interactions confounded (1+2 = III). A Resolution V has one-way and four-way interactions as well as two-way and three-way interactions aliased (1+4 = V = 2+3).
  49. Resolution I: An experiment in which tests are conducted, adjusting one factor at a time, hoping for the best. This experiment is not statistically sound
  50. Resolution ll: An experiment in which some of the main effects are confounded. This is very undesirable.
  51. Resolution III: A fractional factorial design in which no main effects are confounded with each other, but the main effects and two, factor interaction effects are confounded.
  52. Resolution IV: A fractional factorial design in which the main effects and two-factor interaction effects are not confounded, but the two-factor effects may be confounded with each other.
  53. Resolution V: A fractional factorial design in which no confounding of main effects and two-factor interactions occur. However, two-factor interactions may be confounded with three-factor and higher interactions.
  54. Resolution Vl: Also called Resolution V+. This is at least a full factorial experiment with no confounding. It can also mean two blocks of 16 runs.
  55. Resolution Vll: Can refer to eight blocks of 8 runs.
  56. Response surface methodology (RSM): The graph of a system response plotted against one or more system factors. Response surface methodology employs experimental design to discover the “shape” of the response surface and then uses geometric concepts to take advantage of the relationships discovered.
  57. Response variable: The variable that shows the observed results of an experimental treatment. Also known as the output or dependent variable.
  58. Robust design: A term associated with’ the application of Taguchi experimentation in which a response variable is considered robust or immune to input variables that may be difficult or impossible to control.
  59. Screening: A technique to discover the most (probable) important factors experiment in an experimental system. Most screening experiments employ two-level designs. A word of caution about the results of screening experiments, if a factor is not highly significant, it does not necessarily mean that it is insignificant.
  60. Second-order: Refers to the power to which one or more factors appear in a model. If “X1” represents a factor and “B,” is its factor effect, then the model: Y= Bo + B1X1 + B11(X1 * X1)+B2X2+ɛ is second-order in X1 but not in X2. Second-order models can account for curvature and interaction. B12(X1 * X1)  is another second-order example, representing an interaction between X1 and X2.
  61. Sequential experiments: Experiments are done one after another, not at the same time.  This is often required by the type of experimental design being used. Sequential experimentation is the opposite of parallel experimentation.
  62. Simplex: A geometric figure that has a number of vertexes (corners) equal to one more than the number of dimensions in the factor space.
  63. Simplex design: A spatial design used to determine the most desirable variable combination (proportions) in a mixture.
  64.  The sparsity of effects principle states that processes are usually driven by main effects and low-order interactions.
  65. Test coverage: The percentage of all possible combinations of input factors in an experimental test.
  66. Treatments: In an experiment, the various factor levels describe how an experiment is to be carried out. A pH level of 3 and a temperature level of 37° Celsius describe an experimental treatment.

Experimental Objectives

Choosing an experimental design depends on the objectives of the experiment and the number of factors to be investigated. Some experimental design objectives are:

  1. Comparative objective: If several factors are under investigation, but the primary goal of the experiment is to make a conclusion about whether a factor, in spite of the existence of the other factors, is “significant,” then the experimenter has a comparative problem and needs a comparative design solution.
  2. Screening objective: The primary purpose of this experiment is to select or screen out the few important main effects from the many lesser important ones. These screening designs are also termed main effects or fractional factorial designs.
  3. Response surface (method) objective: This experiment is designed to let an experimenter estimate interaction (and quadratic) effects and, therefore, give an idea of the (local) shape of the response surface under investigation. For this reason, they have termed response surface method (RSM) designs. RSM designs are used to:
    • Find improved or optimal process settings
    • Troubleshoot process problems and weak points
    • Make a product or process more robust against external influences
  4. Optimizing responses when factors are proportions of a mixture objective: If an experimenter has factors that are proportions of a mixture and wants to know the “best” proportions of the factors to maximize (or minimize) a response, then a mixture design is required.
  5. Optimal fitting of a regression model objective: If an experimenter wants to model response as a mathematical function (either known or empirical) of a few continuous factors, to obtain “good” model parameter estimates, then a regression design is necessary.

Important practical considerations in planning and running experiments are:

  • Check the performance of gauges/measurement devices first
  •  Keep the experiment as simple as possible
  • Check that all planned runs are feasible
  •  Watch out for process drifts and shifts during the run
  • Avoid unplanned changes (e.g. switching operators at half time)
  •  Allow some time (and back-up material) for unexpected events
  • Obtain buy-in from all parties involved
  • Maintain effective ownership of each step in the experimental plan
  • Preserve all the raw data – do not keep only summary averages!
  • Record everything that happens
  • Reset equipment to its original state after the experiment

Select and Scale the Process Variables

Process variables include both inputs and outputs, I. e. factors and responses. The selection of these variables is best done as a team effort. The team should:

  • Include all important factors (based on engineering and operator judgments)
  •  Be bold, but not foolish, in choosing the low and high factor levels
  • Avoid factor settings for impractical or impossible combinations
  • Include all relevant responses
  • Avoid using responses that combine two or more process measurements
1

When choosing the range of settings for input factors, it is wise to avoid extreme values. In some cases, extreme values will give runs that are not feasible; in other cases, extreme ranges might move the response surface into some erratic region. The most popular experimental designs are called two-level designs. Two-level designs are simple and economical and give most of the information required to go to a multi-level response surface experiment if one is needed. However, two-level designs are something of a misnomer. It is often desirable to include some center points (for quantitative factors) during the experiment (center points are located in the middle of the design “box.”). The choice of a design depends on the number of resources available and the degree of control over making wrong decisions (Type I and Type II hypotheses errors). It is a good idea to choose a design that requires somewhat fewer runs than the budget permits so that additional runs can be added to check for curvature and to
correct any experimental mishaps.

DOE Checklist

Every experimental investigation will differ in detail, but the following checklist will be helpful for many investigations.

  •  Define the objective of the experiment.
  • The principle experimenter should learn as many facts about the process as possible prior to brainstorming.
  • Brainstorm a list of the key independent and dependent variables with people knowledgeable of the process and determine if these factors can be controlled or measured.
  • Run “dabbling experiments” where necessary to debug equipment or determine measurement capability. Develop experimental skills and get some preliminary results.
  • Assign levels to each independent variable in the light of all available knowledge.
  • Select a standard DOE plan or develop one by consultation. It pays to have one person outline the DOE and another review it critically.
  • Run the experiments in random order and analyze results periodically.
  • Draw conclusions. Verify by replicating experiments, if necessary, and proceed to follow-up with further experimentation if an improvement trend is indicated in one or more of the factors.

It is often a mistake to believe that “one big experiment will give the answer.” A more useful approach is to recognize that while one experiment might give a useful result, it is more common to perform two, three, or more experiments before a complete answer is attained. An iterative approach is usually the most economical. Putting all one’s eggs in one basket is not advisable. It is logical to move through stages of experimentation, each stage supplying a different kind of answer.

Experimental Assumptions

In all experimentation, one makes assumptions. Some of the engineering and mathematical assumptions an experimenter can make include:

  • Are the measurement systems capable of all responses?
    It is not a good idea to find, after finishing an experiment, that the measurement devices are incapable. This should be confirmed before embarking on the experiment itself. In addition, it is advisable, especially if the experiment lasts over a protracted period, that a check is made on all measurement devices from the start to the conclusion of the experiment. Strange experimental outcomes can often be traced to ‘hiccups’ in the metrology system.
  • Is the process stable?

    Experimental runs should have control runs that are done at the “standard” process setpoints, or at least at some identifiable operating conditions. The experiment should start and end with such runs. A plot of the outcomes of these control runs will indicate if the underlying process itself drifted or shifted during the experiment. It is desirable to experiment on a stable process. However, if this cannot be achieved, then the process instability must be accounted for in the analysis of the experiment.

  • Are the residuals (the difference between the model predictions and the actual observations) well behaved?
    Residuals are estimates of experimental error obtained by subtracting the observed response from the predicted response. The predicted response is calculated from the chosen model after all the unknown model parameters have been estimated from the experimental data. Residuals can be thought of as elements of variation unexplained by the fitted model. Since this is a form of error, the same general assumptions apply to the group of residuals that one typically uses for errors in general: one expects them to be normally and independently distributed with a mean of 0 and some constant variance. These are the assumptions behind ANOVA and classical regression analysis. This means that an analyst should expect a regression model to err in predicting response in a random fashion; the model should predict values higher and lower than actual, with equal probability. In addition, the level of the error should be independent of when the observation occurred in the study, or the size of the observation being predicted, or even the factor settings involved in making the prediction. The overall pattern of the residuals should be similar to the bell-shaped pattern observed when plotting a histogram of normally distributed data. Graphical methods are used to examine residuals. Departures from assumptions usually mean that the residuals contain a structure that is not accounted for in the model. Identifying that structure, and adding a term representing it to the original model, leads to a better model. Any graph suitable for displaying the distribution of a set of data is suitable for judging the normality of the distribution of a group of residuals. The three most common types are histograms, normal probability plots, and dot plots. Shown below are examples of dot plot results.1

Steps to perform a DOE:

In General

  1. Document the initial information.
  2.  Verify the measurement systems.
  3. Determine if baseline conditions are to be included in the experiment. (This is usually desirable.)
  4. Make sure clear responsibilities are assigned for proper data collection.
  5. Always perform a pilot run to verify and improve data collection procedures.
  6. Watch for and record any extraneous sources of variation.
  7.  Analyze data promptly and thoroughly.
  8. Always run one or more verification runs to confirm results (i.e., go from a narrow to broad inference).

Setting up a DOE

  1. State the practical problem.
    For example, a practical problem may be “Improve yield by investigating factor A and factor B. Use an α of 0.05.”
  2. State the factors and levels of interest.
    For example, factors and levels of interest could be defined as, “Set coded values for factors A and B at -1 and +1.”
  3. Select the appropriate design and sample size based on the effect to be detected.
  4. Create an experimental data sheet with the factors in their respective columns. Randomize the experimental runs in the datasheet. Conduct the experiment and record the results.
  5. Construct an Analysis of Variance (ANOVA) table for the full model.
  6. Review the ANOVA table and eliminate effects with p-values above α. Remove these one at a time, starting with the highest order interactions.
  7.  Analyze the residual plots to ensure that the model fits.
  8.  Investigate the significant interactions (p-value < α). Assess the significance of the highest order interactions first. (For two-way interactions, an interactions plot may be used to efficiently determine optimum settings. For graphical analysis to determine settings for three-way interactions, it is necessary to evaluate two or more interaction plots simultaneously.). Once the highest order interactions are interpreted, analyze the next set of lower-order interactions.
  9. Investigate the significant main effects (p-value < α).
    (Note: If the level of the main effect has already been set as a result of a significant interaction, this step is not needed.). The use of the main effects plots is an efficient way to identify these values. Main effects that are part of statistically valid interactions must be kept in the model, regardless of whether or not they are statistically valid themselves. Care must be taken because, due to
    interactions, the settings chosen from the main effects plot may sometimes lead to a sub-optimized solution. If there is a significant interaction, use an interaction plot, as shown in the following chart.1
  10. State the mathematical model obtained.
    For a 2k design, the coefficients for each factor and interaction are one-half of their respective effects. Therefore, the difference in the mean of the response from the low setting to the high setting is twice the size of the coefficients.
    Commonly available software programs will provide these coefficients as well as the grand mean. The prediction equation is stated, for two factors,:
    y = grand mean + β1X1 + β2X2 + β3(X1 x X2)
  11.  Calculate the percent contribution of each factor and each interaction relative to the total “sum of the squares.” This is also called epsilon squared. It is calculated by dividing the sum of the squares for each factor by the total sum of the squares and is a rough evaluation of “practical” significance.
  12. Translate the mathematical model into process terms and formulate conclusions and recommendations.
  13. Replicate optimum conditions and verify that results are in the predicted range. Plan the next experiment or institutionalize the change.

Example:

1

An organization decided that it wanted to improve yield by investigating the pressure and temperature in one of its processes. Coded values for pressure and temperature were set at -1 and +1. The design and sample size chosen involved two replications of a 22 design for a total of eight runs. The experiment was conducted and the results were recorded as shown.

1

The Analysis of Variance (ANOVA) table for the full model was then constructed:

The ANOVA table was reviewed to eliminate the effects with a p-value above α. Because both main effects and the interaction were below the chosen α of 0.05, all three were included in the final model. The residual plots were analyzed in three ways, to ensure that the model fit:

  1. The residuals were plotted against the order of the data using an Individuals Chart and Run Chart to check that they were randomly distributed about zero.
  2. A normal probability plot was run on the residuals.
  3. A plot of the residuals vs. the fitted or predicted values was run to check that the variances were equal (i.e., the residuals were independent of the fitted values).
1

Creating an interactions plot for pressure and temperature showed that the optimum setting to maximize yield was to set both temperature and pressure at -1.

The chosen mathematical model involved the prediction equation:

 y = grand mean + β1X1 + β2X2 + β3(X1 x X2).

Substituting a grand mean of 14.00 and coefficients of -2.75 for pressure, -5.75 for temperature, and 1.50 for (P x T) into the equation, we get:
y = 14.00 – 2.75(Pressure) – 5.75(Temperature) + 1.5(P x T)
Using the optimum settings of pressure = -1  and
temperature = -1 that were identified earlier forces the setting for the interaction (P x T) to be (-1) x (-1) = +1.

Substituting these values into the prediction equation, we get:
y = 14.00 – 2.75(-1) – 5.75(-1) + 1.5(+1) = 24.00
This equation tells us that, to increase yield, the pressure and temperature must be lowered. The results should be verified via confirmation runs and experiments at even lower settings of temperature and pressure should also be considered.

Selecting Factor setting:

  • Process knowledge: Understand that standard operating conditions in the process could limit the range for the factors of interest. Optimum settings may be outside this range. For this reason, choose bold settings, while never forgetting safety.
  •  Risk: Always consider those bold settings that could possibly endanger equipment or individuals and must be evaluated for such risk. Avoid settings that have the potential for harm.
  • Cost: Cost is always a consideration. Time, materials, and/or resource constraints may also impact the design.
  • Linearity: If there is a suspected nonlinear effect, budget for runs to explore for curvature and also make sure the inference space is large enough to detect the nonlinear effect.

Notation: 

1

The general notation to designate a fractional factorial design is:

Where:
• k is the number of factors to be investigated.
• p designates the fraction of the design.
• 2k-p is the number of runs. For example, a 25 design requires thirty-two runs, a 25-1 (or 24) design requires sixteen runs (a half-fractional design), and a 25-2 (or 23) design requires eight runs (a quarter-fractional design).
• R is the resolution.

Coding:

1

Coding is the representation of the settings picked in a standardized format. Coding allows for a clear comparison of the effects of the chosen factors. The design matrix for 2k factorials is usually shown in standard order. The Yates standard order has the first-factor alternate low settings, then high settings, throughout the runs. The second factor in the design alternates two runs at the low setting, followed by two runs at the high setting.
The low level of a factor is designated with a “-” or -1  and the high level is designated with a “+” or 1.

Coded values can be analyzed using the ANOVA method and yield a y = f (x) prediction equation. The prediction equation will be different for coded vs. uncoded units. However, the output range will be the same. Even though the actual factor settings in an example might be temperature 160° and 180° C, 20% and 40% concentration, and catalysts A and B, all the settings could be analyzed using -1 and +1 settings without losing any validity.

Fractional vs. Full DOEs

There are advantages and disadvantages for all DOEs. The DOE chosen for a particular situation will depend on the conditions involved.
Advantages of full factorial DOEs:

  • All possible combinations can be covered.
  • Analysis is straightforward, as there is no aliasing.

Disadvantages of full factorial DOEs:
The cost of the experiment increases as the number of factors increases. For instance, in a two-factor two-level experiment (22), four runs are needed to cover the effect of A, B, AB, and the grand mean. In a five-factor two-level experiment (25), thirty-two runs are required to do a full factorial. Many of these runs are used to evaluate higher-order interactions that the experimenter may not be interested in. In a 23 experiment, there are five one-way effects (A, B, C, D, E), ten two-ways, ten three-ways, five four-ways, and one five-way effect. The 2experiment has 75% of its runs spent learning about the likely one-way and two-way effects, while the 2design only spends less than 50% of its runs examining these one-way and two-way effects.
Advantages of fractional factorial DOEs:

  • Less money and effort is spent for the same amount of data.
  • It takes less time to do fewer experiments.
  • If data analysis indicates, runs can be added to eliminate confounding.

Disadvantages of fractional factorial DOEs:

  • Analysis of higher order interactions could be complex.
  • Confounding could mask factor and interaction effects.

Setting up a fractional factorial DOE

1

The effect of confounding should be minimized when setting up a fractional factorial. The Yates standard order will show the level settings of each factor and a coded value for all the interactions. For example, when A is high (+1) and B is low (-1), the interaction factor AB is (+1 x -1 = -1). A column for each interaction can thus be constructed as shown here:

Running a full factorial experiment with one more factor (D) would require a doubling of the number of runs. If factor D settings are substituted for a likely insignificant effect, that expense can be saved. The highest interaction is the least likely candidate to have a significant effect. In this case, replacing the A x B x C interaction with factor D allows the experimenter to say ABC was aliased or confounded with D. The three-level interaction still exists but will be confounded with the factor D. All credit for any output change will be attributed to factor D. This is a direct application of the sparsity of effects principle. In fact, there is more aliasing than just D and ABC. Aliasing two-way and three-way effects can also be accomplished and can be computed in two ways:

  1.  By multiplying any two columns together (such as column A and column D), each of the values in the new column (AD) will be either -1 or +1. If the resulting column matches any other (in this case, it will match column BC), those two effects can be said to be confounded.
  2.  The Identity value (I) can be discovered and multiplied to get the aliased values. For example, in this case, because D=ABC (also called the design generator), the Identity value is ABCD. Multiplying this Identity value by a factor will calculate its aliases. Multiplying ABCD and D will equal ABCDD. Because any column multiplied by itself will create a column of 1’s (multiplication identity), the D2 term drops out, leaving ABC and reaffirming that D=ABC.1
1

Adding an additional factor to a full factorial without adding any additional runs will create a half fractional design. (The design has half the runs needed for a full factorial. If a design has one-quarter the runs needed for full factorial analysis, it is a quarter fractional design, etc.) The key to selecting the type of run and number of factors is to understand what the resolution of the design is, for any given number of factors and available runs. The experimenter  must decide how much confounding he or she is willing to accept. A partial list of fractional designs is included below.

Interaction Case Study

1

A simple 2 x 2 factorial experiment (with replication) was conducted in the textile industry. The response variable was ED/MSH (ends down/thousand spindle hours.). The independent factors were RH (relative humidity) and ion level (the environmental level of negative ions). Both of these factors were controllable. A low ED/MSH is desirable since fewer thread breaks means higher productivity. An ANOVA showed the main effects were not significant but the interaction effects were highly significant. Consider the data table and plots in Figure below:
The above interaction plot demonstrates that if the goal is to reduce breaks, an economic choice could be made between low ion/low RH and high ion/high RH.

Randomized Block Plans

1
1

In comparing, a number of factor treatments, it is desirable that all other conditions be kept as nearly constant as possible. The required number of tests may be too large to be carried out under similar conditions. In such cases, one may be able to divide the experiment into blocks, or planned homogeneous groups. When each group in the experiment contains exactly one measurement of every treatment, the experimental plan is called a randomized block plan. A randomized block design for air permeability response is shown below: An experimental scheme may take several days to complete. If one expects some biasing differences among days, one might plan to measure each item on each day or to conduct one test per day on each item. A day would then represent a block. A randomized incomplete block (tension response) design is shown below: Only treatments A, C, and D are run on the first day. B, C, and D on the second, etc. In the whole experiment, note that each pair of treatments, such as BC, occur twice together. The order in which the three treatments are run on a given day follows a randomized sequence. Blocking factors are commonly environmental phenomena outside of the control of the experimenter.

Latin Square Designs

A Latin square design is called a ope-factor design because it attempts to measure the effects of a single key input factor on an output factor. The experiment further attempts to block (or average) the effects of two or more nuisance factors. Such designs were originally applied in agriculture when the two sources of non- homogeneity (nuisance factors) were the two directions on the field. The square was literally a plot of ground. In Latin square designs, a third variable, the experimental treatment, is then applied to the source variables in a balanced fashion. The Latin square plan is restricted by two conditions:

  1.  The number of rows, columns, and treatments must be the same.
  2. There should be no expected interactions between row and column factors, since these cannot be measured. If there are, the sensitivity of the experiment is reduced.

A Latin square design is essentially a fractional factorial experiment which requires less experimentation to determine the main treatment results.

1

Consider the following 5 x 5 Latin square design:In the above design, five drivers and five carburetors were used to evaluate gas mileage from five cars (A, B, C, D, and E). Note that only twenty-five of the potential 125 combinations are tested. Thus, the resultant experiment is a one-fifth fractional factorial. Similar 3 x 3, 4 x 4, and 6 x 6 designs may be utilized. In some situations, what is thought to be a nuisance factor can end up being very important.

Graeco-Latin Designs

1

Graeco-Latin square designs are sometimes useful to eliminate more than two sources of variability in an experiment. A Graeco-Latin design is an extension of the Latin square design, but one extra blocking variable is added for a total of three blocking variables. Consider the following 4 X 4 Graeco-Latin design: The output (response) variable could be gas mileage for the 4 cars (A, B, C, D).

Hyper-Graeco-Latin Designs

1

A hyper-Graeco-Latin square design permits the study of treatments with more than three blocking variables. Consider the following 4 x 4 hyper-Graeco-Latin design:

The output (response) variable could be gas mileage for the 4 cars (A, B, C, D).

Two-Level Fractional Factorial Example

The basic steps for a two-level fractional factorial design will be examined via the following hypothetical example. The following seven-step procedure will be followed:

  1. Select a process
  2. Identify the output factors of concern
  3. Identify the input factors and levels to be investigated
  4. Select a design (from a catalogue, Taguchi, self created, etc.)
  5. Conduct the experiment under the predetermined conditions
  6. Collect the data (relative to the identified outputs)
  7. Analyze the data and draw conclusions

Step 1: Select a process
We want to investigate UPSC(Union Public Service Commission) Prelims exam success using students of comparable educational levels.
Step 2: Identify the output factors
Student performance will be based on two results (output factors):
(1) Did they pass the test?
(2) What grade score did they receive?
Step 3: Establish the input factors and levels to be investigated
We want to study the effect of seven variables at two-level that may affect student performance. (7 factors at 2-levels)

Input factorLevel 1(-)Level 2(+)
UPSC coachingNOYes
Study timeMorningAfternoon
Problem worked200800
Primary ReferenceBook ABook B
Method of studySequentialRandom
Work experience0 years4 years +
Duration of study50 hours120 hours

Note: The above inputs are both variable (quantitative) and attribute (qualitative).
Step 4: Select a design
A screening plan is selected from a design catalogue. Only eight (8) tests are needed to evaluate the main effects of all 7 factors at 2-levels. The design is:

Input factors
TESTSABCDEFG
#1
#2++++
#3++++
#4++++
#5++++
#6++++
#7++++
#8++++

One test example:

Test #3 means:

  • A (-) = No UPSC coaching
  • B (+) = Study in afternoon
  • C (+) = Work 800 problems
  • D (-) = Use reference book A
  • E (-) = Use sequential study method
  • F (+) = Have 4 years + of work experience
  • G (+) = Study 120 hours for the test
1

Step 5: Conduct the experiment
Step 6: Collect the data

1

Step 7: Analyze the data and draw conclusions
The pass/fail pattern of (+)s and (-)s does not track with any single input factor. It visually appears that there is some correlation with factors C & G

(+) means level 2 has a positive effect. (-) means level 2 has a negative effect. 0 means level 2 has no effect.

  • Factor A, taking coaching , will improve the exam results by 13 points
  • Factor B, study time of day, has no effect on exam results
  • Factor C, problems worked, will improve the exam results by 20 points
  • Factor D, primary reference, will improve the exam results by 5 points
  • Factor E, method of study, has no effect on exam results
  • Factor F, work experience, has no effect on exam results
  • Factor G, duration of study, will improve the exam results by 23 points
1

To calculate the optimum student performance:
1. Sum the arithmetic value of the significant differences (Δ) and divide the total by two. Call this value the improvement. Note that the absolute value is divided by 2 because the experiment is conducted in the middle of the high and low levels and only one—half the difference (Δ) can be achieved.

1
1

Improvement = 61 + 2 = 30.5. There were no significant negative effects (-) in this experiment. If there were, they would have been included (added) in determining the total effect. In this particular DOE format, the sign indicates direction only.
2. Average the test scores obtained in tests 1 through 8.
Average = 61.5
3. Add the improvement to the average to predict the optimum performance. .
Optimum = Average + Improvement
= 61.5 + 30.5
= 92
The optimum performance would be obtained by running the following trial: The above trial was one of the 120 tests not performed out of 128 possible choices. Obviously, the predicted student scores can be confirmed by additional experimentation.

1
1
1

One can further examine the significance of the design results using the sum of squares and a scree plot. A scree plot is so named because it looks like the rubble or rocky debris lying on a slope or at the base of a cliff. The scree plot indicates that factors D, B, E, and F are noise. The SS (sum of squares) for the error term is 3.1 (3.1 + 0 + 0 + 0)
MSE (mean square error) = T =3.1/4= 0.775
The maximum F ratio for factor G Is: 61.5/0.775= 85.29
The critical maximum F value from the following F Table for k – 1 = 7, p = 4 and α = 0.05 is 73. Thus, factor G is important at the 95% confidence level.
The maximum F table accommodates screening designs for runs of 8, 12, 16, 20, and 24. p is the number of noise factors averaged to derive the MSE, and k is the number of runs.
The maximum F ratio for factor C is 50/0.775 = 65.42
The critical maximum F value for k – 1 = 7, p = 4 and d = 0.10 is 49. Thus, factor C is important at the 90% confidence level.
The maximum F ratio for factor A  is 21.1/0.775= 27.22
The critical maximum F values for both alpha values are larger than 27.22. Therefore, factor A is not considered important (at these alpha levels).

A Full Factorial Example

1
1

Suppose that pressure, temperature, and concentration are three suspected key variables affecting the yield of a chemical process that is currently running at 64%. An experimenter may wish to fix these variables at two-levels (high and low) to see how they influence yield. In order to find out the effect of all three factors and their interactions, a total of 2 x 2 x 2 = 23 = 8 experiments must be conducted. This is called a full factorial experiment. The low and high levels of input factors are noted below by (-) and (+).
Temperature:    (-) = 120°C        (+) = 150°C
Pressure:              (-) = 10 psi         (+) = 14 psi
Concentration: (-) = 10N             (+) = 12N
To find the effect of temperature, sum the yield values when the temperature is high and subtract the sum of yields when the temperature is low, dividing the results by four.

1

When the temperature is set at a high level rather than at a low level, one gains 23.5% yield. All of this yield improvement can be attributable to temperature alone since, during the four high temperature experiments, the other two variables were twice low and twice high.

1
1

The effect of changing the pressure from a low level to a high level is a loss of 6% yield. Higher concentration levels result in a relatively minor 2% improvement in yield. The interaction effects between the factors can be checked by using the T, P, and C columns to generate the interaction columns by the multiplication of signs: Note, a formal analysis of the above data (developing a scree plot and MSE term) would indicate that only the temperature effect is significant.

1
1

 Following the same principles used for the main effects, :* interaction means the change in yield when the pressure and temperature values are both low or both high, as opposed to when one is high and the other is low. The T x P interaction shows a marginal gain in yield when the temperature and pressure are both at the same level.

In this example, the interactions have either zero or minimal negative yield effects.  If the interactions are significant compared to the main effects, they must be considered before choosing the final level combinations. The best combination of factors here is a high temperature, low pressure, and high concentration (even though the true concentration contribution is probably minimal).

Comparison to a Fractional Factorial Design
1
1

In some situations, an experimenter can derive the same conclusions by conducting fewer experiments. Suppose the experiments cost Rs 1,00,000 each, one might then decide to conduct a one-half fractional factorial experiment.
Assume the following balanced design is chosen. Since a fractional factorial experiment is being conducted, only the main effects of factors can be determined. Please note that experiments 1, 4, 6, and 7 would have been equally valid. The results are not exactly identical to what was obtained by conducting eight experiments previously. But, the same relative conclusions as to the effects of temperature, pressure, and concentration on the final yield can be drawn. The average yield is 63.25%. If the temperature is high, an 11.75% increase is expected, plus 3.25% for low pressure, plus 1.25% for high concentration equals an anticipated maximum yield of 79.5% even though this experiment was not conducted. This yield is in line with the actual results from experiment number 6 from the full factorial.

MINITAB Results

1
1
1

Most people don’t analyze experimental results using manual techniques. The following is a synopsis of the effects of temperature, pressure, and concentration on yield results using MINITAB. This analysis represents the very same data for the previously presented examples.
The F values and corresponding p-values indicate that temperature and pressure are 0 significant to greater than 99% certainty. Concentration might also be important but, more replications would be necessary to see if the 93% certainty could be improved to something greater than 95%.
The regression equation will yield results similar to those for the previous manual calculations. Again, the p-values for temperature and pressure reflect high degrees of certainty.
Using either the manual or MINITAB recaps, would the experimenter stop at this point? Might a follow-up experiment, perhaps at three levels looking at higher temperatures and lower pressures, pay off? After all, the yield has improved by 16% since experimentation started.

DOE Variations

Response Surface Method

The Response Surface Method (RSM) is a technique that enables the experimenter to find the optimum condition for a response (y) given two or more significant factors (x’s). For the case of two factors, the basic strategy is to consider the graphical representation of the yield as a function of the two significant factors. The RSM graphic is similar to the contours of a topographical map. The higher up the “hill,” the better the yield. Data is gathered to enable the contours of the map to be plotted. Once done, the resulting map is used to find the path of steepest ascent to the maximum or steepest descent to the minimum. The ultimate RSM objective is to determine the optimum operating conditions for the system or to determine a region of the factor space in which the operating specifications are satisfied (usually using a second-order model).

RSM terms:

  • Response surface: It is the surface represented by the expected value of an output modeled as a function of significant inputs (variable inputs only):
    Expected (y) = f (x1, x2, x3,…xn)
  • The method of steepest ascent or descent is a procedure for moving sequentially along the direction of the maximum increase (steepest ascent) or maximum decrease (steepest descent) of the response variable using the first-order model:
    y (predicted) = β0 + Σ βi x
  • The region of curvature is the region where one or more of the significant inputs will no longer conform to the first-order model. Once in this region of operation, most responses can be modeled using the following fitted second-order model:
    y (predicted) = β0 + Σ βi xi + Σ βii xixi +  Σ βij xixj
  • The central composite design is a common DOE matrix used to establish a valid second-order model.

Steps for Response Surface Method

1

1. Select the y. Select the associated confirmed x’s and boldly select their experimental ranges. These x’s should have been confirmed to have a significant effect on the y through prior experimentation.
2. Add center points to the basic 2k-p design. A center point is a point halfway between the high and low settings of each factor.
3. Conduct the DOE and plot the resulting data on a response surface.
4. Determine the direction of the steepest ascent to an optimum y.
5. Reset the x values to move the DOE in the direction of the optimum y. In general, the next DOE should have x values that overlap those used in the previous experiment.
6. Continue to conduct DOEs, evaluate the results, and step in the direction of the optimal y until a constraint has been encountered or the data shows that the optimum has been reached.

1

7. Add additional points to the last design to create a central composite design to allow for a second-order evaluation. This will verify if the analysis is at a maximum or minimum condition. If the condition is at an optimum solution, then the process is ended. If the second-order evaluation shows that the condition is not yet at optimum, it will provide direction for the next sequential experiment.

RSM is intended to be a sequence of experiments with an attempt to “dial in to an optimum setting.” Whenever an apparent optimum is reached, additional points are added to perform a more rigorous second-order evaluation.

Plackett-Burman Designs:   

1

Plackett-Burman designs are used for screening experiments. Plackett- Burman designs are very economical. The run number is a multiple of four rather than a power of 2. Plackett-Burman geometric designs are two-level designs with 4, 8, 16, 32, 64, and  128 runs and work best as screening designs. Each interaction effect is confounded with exactly one main effect. All other two-level Plackett-Burman designs (12, 20, 24, 28, etc.) are non-geometric designs. In these designs, a two-factor interaction will be partially confounded with each of the other main effects in the study. Thus, the non-geometric designs are essentially “main effect designs,” when there is reason to believe that any interactions are of little significance. For example, a Plackett-Burman design in 12 runs may be used to conduct an experiment containing up to 11 factors. With a 20-run design, an experimenter can do a screening experiment for up to 19 factors. As many as 27 factors can be evaluated in a 28-run design.

Plackett-Burman designs are orthogonal designs of Resolution III that are primarily used for screening designs. Each two-way interaction is positively or negatively aliased with the main effect.
Advantages:
• A limited number of runs are needed to evaluate a lot of factors.
• Clever assignment of factors might allow the Black Belt to determine which factor caused the output, despite aliasing.
Disadvantages:
• It assumes the interactions are not strong enough to mask the main effects.
• Aliasing can be complex.

A Design from a Design Catalogue

1

The preferred DOE approach examines (screens) a large number of factors with highly fractional experiments. Interactions are then explored or additional levels examined once the suspected factors have been reduced. A one-eighth fractional factorial design is shown below. A total of seven factors are examined at two levels. In this design, the main effects are independent of interactions, and six independent, two-factor interactions can be measured. This design is an effective screening experiment. This particular design comes from a design catalog. Often experimenters will obtain a design generated by a statistical software program. Since this is a one-eighth fractional factorial, there are seven other designs that would work equally as well.
Often, a full factorial or three-level fractional factorial trial (giving some interactions) is used in the follow-up experiment.
Note: 0 = low level and 1 = high level.

A Three-Factor, Three-Level Experiment

Often, a three-factor experiment is required after screening a large number of variables. These experiments may be full or fractional factorial. A one-third fractional factorial design is shown below. Generally, the (-) and (+) levels in two-level designs are expressed as O and 1 in most design catalogues. Three-level designs are often represented as O, 1, and 2.

1
1


From a design catalogue test plan, the selected fractional factorial experiment looks
EVOP and PLEX designs

1

Evolutionary operation (EVOP) is a continuous improvement design. Plant experimentation (PLEX) is a sequence of corrective designs meant to obtain rapid improvement. Both designs are typically small full factorial designs with possible entry points. They are designed to be run while maintaining production; therefore, the inference space is typically very small. EVOP (evolutionary operations) emphasizes a conservative experimental strategy for continuous process improvement. Tests are carried out in phase A until a response pattern is established. Then phase B is centered on the best conditions from phase A. This procedure is repeated until the best result is determined. When nearing a peak, the experimenter will then switch to smaller step sizes or will examine different variables. EVOP can entail small incremental changes so that little or no process scrap is generated. Large sample sizes may be required to determine the appropriate direction of improvement. The method can be extended to more than two variables, using simple main effects experiment designs. The experiment naturally tends to change variables in the direction of the expected improvement, and thus, follows an ascent path. In EVOP experimentation there are few considerations to be taken into account since only two or three variables are involved. The formal calculation of the direction of the steepest ascent is not particularly helpful.

Advantages:

  • They do not disrupt production and can be used in an administrative situation.
  • They force the organization to investigate factor relationships and prove factory physics.

Disadvantages:

  • They can be time-consuming. For example, because, in PLEX, levels are generally set conservatively to ensure that production is not degraded, it is sometimes difficult to prove statistical validity with a single design. A first design may be used to simply decide factor levels for a subsequent design.
  • They require continuous and significant management support.

Box-Wilson (central composite) design:

A Box-Wilson design is a rotatable design (subject to the number of blocks) that allows for the identification of nonlinear effects. Rotatability is the characteristic that ensures constant prediction variance at all points equidistant from the design center and thus improves the quality of prediction. The design consists of a cube portion made up from the characteristics of 2k  factorial designs or 2k-n fractional factorial designs, axial points, and center points.

Advantages:

  • It is a highly efficient second-order modeling design for quantitative factors.
  • It can be created by adding additional points to a 2k-p design, provided the original design was at least Resolution V or higher.

Disadvantages:

  • It does not work with qualitative factors.
  •  Axial points may exceed the settings of the simple model and may be outside the ability of the process to produce.

Box-Behnken design:

A Box-Behnken design looks like a basic factorial design with a center point, except that the corner points are missing and replaced with points on the edges. This type of design is used when the corner
point settings are impossible or impractical because of their combined severity. Running three factors at their high settings could produce a volatile situation.

Advantages:

  • It is more efficient than three-level full factorials.
  • It is excellent for trials where corner points are not recommended.
  • It allows all two-factor interactions to be modeled.
  • It can identify interactions and quadratic effects.

Disadvantages:

  • Enough trials must be run to estimate all one way and two-way effects (even if only one-way effects are of interest).
  • It is hard to modify into other studies.

Back to Home Page

If you need assistance or have any doubt and need to ask any question  contact us at: preteshbiswas@gmail.com. You can also contribute to this discussion and we shall be very happy to publish them in this blog. Your comment and suggestion is also welcome.

Nonparametric Tests

The hypothesis testing presented in my previous two posts presents a number of tests of hypothesis for continuous, dichotomous, and discrete outcomes. Tests for continuous outcomes focused on comparing means, while tests for dichotomous and discrete outcomes focused on comparing proportions. All of the tests presented in the modules on hypothesis testing are called parametric tests and are based on certain assumptions. For example, when running tests of hypothesis for means of continuous outcomes, all parametric tests assume that the outcome is approximately normally distributed in the population. This does not mean that the data in the observed sample follows a normal distribution, but rather that the outcome follows a normal distribution in the full population which is not observed. For many outcomes, investigators are comfortable with the normality assumption (i.e., most of the observations are in the center of the distribution while fewer are at either extreme). It also turns out that many statistical tests are robust, which means that they maintain their statistical properties even when assumptions are not entirely met. Tests are robust in the presence of violations of the normality assumption when the sample size is largely based on the Central Limit Theorem. When the sample size is small and the distribution of the outcome is not known and cannot be assumed to be approximately normally distributed, then alternative tests called nonparametric tests are appropriate.

Parametric vs. Nonparametric Tests

Parametric implies that distribution is assumed for the population. Often, an assumption is made when performing a hypothesis test that the data is a sample from a certain distribution, commonly the normal distribution. Nonparametric implies that there is no assumption of a specific distribution for the population. An advantage of a parametric test is that if the assumptions hold, the power, or the probability of rejecting H0, when it is false, is higher than the power of a corresponding nonparametric test with equal sample sizes. An advantage of nonparametric tests is that the test results are more robust against violation of the assumptions. Therefore, if assumptions are violated for a test based upon a parametric model, the conclusions based on parametric test p-values may be more misleading than conclusions, based upon nonparametric test p-values.

Nonparametric tests are sometimes called distribution-free tests because they are based on fewer assumptions (e.g., they do not assume that the outcome is approximately normally distributed). Parametric tests involve specific probability distributions (e.g., the normal distribution) and the tests involve estimation of the key parameters of that distribution (e.g., the mean or difference in means) from the sample data. The cost of fewer assumptions is that nonparametric tests are generally less powerful than their parametric counterparts (i.e., when the alternative is true, they may be less likely to reject H0).

It can sometimes be difficult to assess whether a continuous outcome follows a normal distribution and, thus, whether a parametric or nonparametric test is appropriate. There are several statistical tests that can be used to assess whether data are likely from a normal distribution. The most popular is the Kolmogorov-Smirnov test, the Anderson-Darling test, and the Shapiro-Wilk test. Each test is essentially goodness of fit test and compares observed data to quantiles of the normal (or other specified) distribution. The null hypothesis for each test is H0: Data follow a normal distribution versus H1: Data do not follow a normal distribution. If the test is statistically significant (e.g., p<0.05), then data do not follow a normal distribution, and a nonparametric test is warranted. It should be noted that these tests for normality can be subject to low power. Specifically, the tests may fail to reject H0: Data follow a normal distribution when in fact the data do not follow a normal distribution. Low power is a major issue when the sample size is small – which unfortunately is often when we wish to employ these tests. The most practical approach to assessing normality involves investigating the distributional form of the outcome in the sample using a histogram and augmenting that with data from other studies, if available,  that may indicate the likely distribution of the outcome in the population. There are some situations when it is clear that the outcome does not follow a normal distribution. These include situations:

  • when the outcome is an ordinal variable or a rank,
  • when there are definite outliers or
  • when the outcome has clear limits of detection.

Nonparametric Techniques

Nonparametric techniques of hypothesis testing are applicable for many quality engineering problems and projects. The nonparametric tests are often called “distribution-free” since they make no assumption regarding the population distribution. Nonparametric tests may be applied ranking tests in which data is not specific in any continuous sense, but are simply ranks. Parametric tests are generally more powerful and can test a wider range of alternative hypotheses. It is worth repeating that if data are approximately normally distributed then parametric tests (as in the modules on hypothesis testing) are more appropriate. However, there are situations in which assumptions for a parametric test are violated and a nonparametric test is more appropriate.

In nonparametric tests, the hypotheses are not about population parameters (e.g., μ=50 or μ12).   Instead, the null hypothesis is more general.   For example, when comparing two independent groups in terms of a continuous outcome, the null hypothesis in a parametric test is H0: μ12. In a nonparametric test, the null hypothesis is that the two populations are equal, often this is interpreted as the two populations are equal in terms of their central tendency.

Nonparametric tests have some distinct advantages. With outcomes such as those described above, nonparametric tests may be the only way to analyze these data. Outcomes that are ordinal, ranked, subject to outliers or measured imprecisely are difficult to analyze with parametric methods without making major assumptions about their distributions as well as decisions about coding some values (e.g., “not detected”). As described here, nonparametric tests can also be relatively simple to conduct.

Continuous data are quantitative measures based on a specific measurement scale (e.g., weight in pounds, height in inches). Some investigators make the distinction between continuous, interval and ordinal scaled data. Interval data are like continuous data in that they are measured on a constant scale (i.e., there exists the same difference between adjacent scale scores across the entire spectrum of scores). Differences between interval scores are interpretable, but ratios are not. The temperature in Celsius or Fahrenheit is an example of an interval scale outcome. The difference between 30º and 40º is the same as the difference between 70º and 80º, yet 80º is not twice as warm as 40º. Ordinal outcomes can be less specific as the ordered categories need not be equally spaced. Symptom severity is an example of an ordinal outcome and it is not clear whether the difference between much worse and slightly worse is the same as the difference between no change and slightly improved. Some studies use visual scales to assess participants’ self-reported signs and symptoms. Pain is often measured in this way, from 0 to 10 with 0 representing no pain and 10 representing agonizing pain. Participants are sometimes shown a visual scale such as that shown in the upper portion of the figure below and asked to choose the number that best represents their pain state. Sometimes pain scales use visual anchors as shown in the lower portion of the figure below.1

In the upper portion of the figure, certainly, 10 is worse than 9, which is worse than 8; however, the difference between adjacent scores may not necessarily be the same. It is important to understand how outcomes are measured to make appropriate inferences based on statistical analysis and, in particular, not to overstate precision.

Assigning Ranks

The nonparametric procedures that we describe here follow the same general procedure. The outcome variable (ordinal, interval, or continuous) is ranked from lowest to highest and the analysis focuses on the ranks as opposed to the measured or raw values. For example, suppose we measure self-reported pain using a visual analog scale with anchors at 0 (no pain) and 10 (agonizing pain) and record the following in a sample of n=6 participants:

                            7               5               9              3             0               2

 The ranks, which are used to perform a nonparametric test, are assigned as follows: First, the data are ordered from smallest to largest. The lowest value is then assigned a rank of 1, the next lowest a rank of 2, and so on. The largest value is assigned a rank of n (in this example, n=6). The observed data and corresponding ranks are shown below:

Ordered Observed Data:

0

2

3

5

7

9

Ranks:

1

2

3

4

5

6

A complicating issue that arises when assigning ranks occurs when there are ties in the sample (i.e., the same values are measured in two or more participants). For example, suppose that the following data are observed in our sample of n=6:

Observed Data:       7         7           9            3           0          2

The 4th and 5th ordered values are both equal to 7. When assigning ranks, the recommended procedure is to assign the mean rank of 4.5 to each (i.e. the mean of 4 and 5), as follows:

Ordered Observed Data:

0.5

2.5

3.5

7

7

9

Ranks:

1.5

2.5

3.5

4.5

4.5

6

Suppose that there are three values of 7.   In this case, we assign a rank of 5 (the mean of 4, 5 and 6) to the 4th, 5th and 6th values, as follows:

Ordered Observed Data:

0

2

3

7

7

7

Ranks:

1

2

3

5

5

5

Using this approach of assigning the mean rank when there are ties ensures that the sum of the ranks is the same in each sample (for example, 1+2+3+4+5+6=21, 1+2+3+4.5+4.5+6=21, and 1+2+3+5+5+5=21). Using this approach, the sum of the ranks will always equal n(n+1)/2. When conducting nonparametric tests, it is useful to check the sum of the ranks before proceeding with the analysis.

To conduct nonparametric tests, we again follow the five-step approach outlined in the modules on hypothesis testing.

  1. Set up hypotheses and select the level of significance α. Analogous to parametric testing, the research hypothesis can be one- or two-sided (one- or two-tailed), depending on the research question of interest.
  2. Select the appropriate test statistic. A test statistic is a single number that summarizes the sample information. In nonparametric tests, the observed data is converted into ranks and then the ranks are summarized into a test statistic.
  3. Set up decision rule. The decision rule is a statement that tells under what circumstances to reject the null hypothesis. Note that in some nonparametric tests we reject H0 if the test statistic is large, while in others we reject H0 if the test statistic is small. We make the distinction as we describe the different tests.
  4. Compute the test statistic. Here we compute the test statistic by summarizing the ranks into the test statistic identified in Step 2.
  5. Conclusion. The final conclusion is made by comparing the test statistic (which is a summary of the information observed in the sample) to the decision rule.   The final conclusion is either to reject the null hypothesis (because it is very unlikely to observe the sample data if the null hypothesis is true) or not to reject the null hypothesis (because the sample data are not very unlikely if the null hypothesis is true).

Three powerful nonparametric techniques will be described with examples: Kendall Coefficient of Concordance, Spearman Rank Correlation Coefficient (rs). and Kruskal- Wallis one-way analysis of variance.

Kendall Coefficient of Concordance

Example: At a textile plant, some years ago, the primary product was denim. An important customer characteristic was “hand.” That is, how the fabric drapes and feels to the touch. Traditionally, the hand was evaluated by individuals (judges or inspectors) who had become experts over time by literally handling the fabric. The lab manager had obtained, on trial from the vendor, a “handleometer,” an instrument to objectively measure hand. She believed that the current subjective procedure for determining hand was too insensitive to change and ineffective in establishing a common customer specification. The plant manager, two department heads, and a product engineer (the plant judgment panel) were opposed to the handleometer. They said that the handleometer only measures the bending moment of fabric while they recognized multidimensional aspects of hand: stiffness, friction, drape, etc. The two measuring systems were compared using an analytic technique to determine whether the four-panel members represented a statistically homogeneous decision-making group. Secondly, to correlate the panel average ranking with the handleometer ranked values. Ten random samples from production were obtained.  The panel members were to independently rank them from most to least with no ties  (although the expanded procedure permits ties), 10 samples are to be independently ranked by 4 judges or inspectors for the sensory response variable, hand. The null hypothesis is that the judge’s rankings are independent of each other. The judges independently ranked the samples for the characteristic specified. The Kendall statistics are calculated:

  • Each judge ranks the samples from 1 to 10 (rank 1 is most hand)
  •  Sum the ranks of each judge (ΣR)
  •  Determine the average rank
  • Subtract the rank sum for each judge from the average rank (ΣR)
  • Square the rank sum differences (ΣR ) 2
  •  Sum the squares of the rank sum differences Σ[ΣR ] 2)
1
1

R̅= 220/10 = 22                    s = 1066                                        K = Judges = 4 N = Samples =10
Degrees of freedom = ν = N – 1 = 9                                                            Critical chi square = χ20.01,9= 21.67
The null hypothesis is rejected. The calculated chi-square is larger than the critical chi-square. The four judges’ rankings are not independent of each other. They constitute a homogeneous panel. This does not say that they are incorrect; only that they respond in a uniform way to this form of sensory input.

The Spearman Rank Correlation Coefficient (rs)

1

The Spearman correlation coefficient is a measure of association that requires that both variables be measured in at least an ordinal scale so that the samples or individuals to be analyzed may be ranked in two ordered series. If one of the series is continuous and one is ranked, then both series must be ranked. If both series contain continuous data from an unknown distribution, both series must be ranked.
Example: The ten rank sums from the Kendall coefficient example are ranked from largest to smallest. The rank numbers from 1 through 10 are then assigned to the ranked panel sums. For the same samples, the handleometer values are ranked and then assigned the integer values from 1 through 10. The differences between the paired ranks are squared and summed.

1

N = 10. If N is equal to or greater than 10, the following correlation equation can be used.

The strong correlation (0.97) between the ranked handleometer variable measurements and the ranked panel subjective sensory responses of judges, shows that the handleometer could replace people. The handleometer values can be obtained more quickly, with greater objectivity, and with a longer life span than individuals. The lab manager was disappointed to learn that the instrument would not be purchased, due to the objections presented before the analysis.

Kruskal-Wallis One-Way Analysis of Variance by Ranks

This is a test of independent samples. The measurements may be continuous data, but the underlying distribution is either unknown or known to be non-normal. In either case, the data can be ranked and analyzed without the constraint of having to assume a known population distribution.
Example: Three different plants manufactured the same garment style. Variation in garment length was a customer concern. The length was measured to the nearest 1/4″. Within each plant, only four measurement increment values were obtained. This lack of measurement sensitivity indicated that ranking the data was preferred to assuming normality. The null hypothesis is that the population medians are the same. Ho: M1 = M2 =… = Mn. The following table shows data coded as deviations from a common reference value.

Original Data Measurements (Coded)

Plant APlant BPlant C
0.25 0.50 0.25
0.251.001.00
0.50 0.25 1.00
1.00 0.75 0.75
0.50 0.25 1.00
0.50 0.25 0.50
0.25 1.00
0.75  

For simplicity and convenience, the coded data can be further coded as integers.

Plant APlant BPlant C
121
144
214
433
214
212
1 4
3  
1

The next step is to construct a combined sample, rank the combined data while retaining plant identity, and reconstitute the three plant sample sets with ranks replacing the original data. Tied ranks are replaced by the average value of the ties.
There were seven coded values tied at 4. They would have been ranks 1 through 7. The average of ranks 1 – 7 is 4. All coded measurement values of 1 received the average rank of 4. In a similar fashion, the five coded values tied at 2 received the average rank of 10. The three coded values tied at 3 received the average rank of 14,
and the six coded values tied at 4 received the average rank of 18.5. Reconstitute the original sample sets of coded data of plants A, B, and C with the final tied ranks. In some applications, there may be both individual ranks and tied ranks. Wherever there are tied ranks, they are to be used. Now do the following analysis for plant columns A, B, and C.

Plant APlant BPlant C
444
4410
4414
101018.5
101418.5
1018.518.5
14 18.5
18.5  
74.554.5102.0Rank Sum
867n
693.781495.0421486.286(Rank Sum)2/n

G = ∑(Rank Sum)2/n = 693.781 + 495.042 + 1486.286 = 2675.109   N = 8 + 6 + 7 = 21
The significance statistic is H. H is distributed as chi-square. Tie values are included in the calculation of chi-square.
Let t = number of tied values in each tied set. Then T = t3 – t for that set.

Tied SettT
17336
25120
3324
46210
1

Let J = ∑T = 690 Let k = number of sample sets.  DF = k – 1 = 3 – 1 = 2.      Let α = 0.05.
Critical chi square =χ20.05,2 = 5.99
H is less than critical chi-square. Therefore, the null hypothesis of equality of population medians cannot be rejected.

Mann-Whitney U Test

With ordinal measurements, the Mann-Whitney U test is used to test whether two independent groups have been drawn from the same population. This is a powerful nonparametric test and is an alternative to the t-test when the normality of the population is either unknown or believed to be non-normal. Consider two populations, A and B. The null hypothesis, Ho, is that and B have the same frequency distribution with the same shape and spread (the same median). An alternative hypothesis, H1, is that A is larger than B, a directional hypothesis. We accept H1, if the probability is greater than 0.5 that a score from A is larger than a score from B. That is, if a is one observation from population A, and b is one observation from population B, then H1 is that P (a > b) > 0.5. If the evidence from the data supports H1, this implies that the bulk of the population is higher than the bulk of population B. If we wished to test if B is statistically larger than A, then H1 is P (a > b) < 0.5. For a 2-tailed test, that is, for a prediction of differences that does not state direction, H1 would be P (a > b) ≠ 0.5 (the medians are not the same).

If there are n1, observations from population A, and n2 observations from population B, rank all (n1 + n2) observations in ascending order. Ties receive the average of their rank number. The data sets should be selected so that n1<n2. Calculate the sum of observation ranks for population A, and designate the total as Ra, and the sum of observation ranks for population B, and designate the total as Rb.

Ua=n1 n2+O.5n1(n1+1)-Ra
Ub=n1 n2+0.5 n2( n2+1)-Rb
Where Ua + Ub = n1 n 2

Calculate the U statistic as the smaller of Ua and Ub. For n2≤ 20, Mann-Whitney tables are used to determine the probability, based on the U, n1, and n2 values. This probability is then used to reject or fail to reject the null hypothesis. If n2 > 20, the distribution of U rapidly approaches the normal distribution and the following apply:

1
1
1
1
1
1
1
1

Umean = µu = 0.5 n1 n2Example: Consider an experimental group (E) and a control group (C) with scores as shown in Table below. Note that n1 = 3 and n2 = 4. Does the experimental group have higher scores than the control group? Ho: A and B have the same median. H1: median A is larger than median B. Accept H1: if P (a > b) > 0.5.To find U, we first rank the combined scores in ascending order, being careful to retain each score’s identity as either an E or C
U = minimum(Ue, Uc) = minimum(3, 9) = 3. The Ho probability for n1 = 3, n1 = 4, and U = 3 is shown in Table below as P = 0.200. Since this is less than 0.5, we fail to reject Ho and conclude that scores for both groups have come from the same population. The probabilities in the Tables given below are one-tailed. For a two-tailed test, the values for P shown in the Table should be doubled.

Wilcoxon-Mann-Whitney Rank Sum Test

1

The Wilcoxon-Mann-Whitney rank-sum test is similar in application to the Mann- Whitney Test. The null hypothesis is that the two independent random samples are from the same distribution. The alternate hypothesis is the two distributions are different in some way. Note that this test does not require normal distributions.
The observations or scores of the two samples (A and B) are combined in order of increasing rank and given a rank number. Tied values are assigned tied rank values. In cases where equal results occur, the mean of the available rank numbers is assigned. Next find the rank-sum, R, of the smaller sample. Let N equal the size of the combined samples (N = n1 + n2) and n equal the size of the smaller sample. Then calculate:     R’ = n (N + 1) – R
The rank-sum values, R and R’, are compared with critical values from the Table below. It represents critical values of the smaller rank-sum. If either R or R’ is less than the critical value, the null hypothesis of equal means is rejected. If n2 > 20, the equations from the U test given above are used for the Z calculation.
Example: Determine if the data from samples A and B  have the same distribution. The null hypothesis, Ho, is the data from samples A and B have the same median. The alternate hypothesis, H1, is A median is larger than B median.nA=9, nB=10,N=19, R=77 and R’=n(N+1)-R=(9)(20)-77=103 ,
Let α = 0.05 for a one-tailed test. From the Table below the critical value is 69. Since R = 77 is larger than 69, we fail to reject the null hypothesis of equal means. If H1 had been A median is different than B median, then a two-tailed test would have been used.

1

Wilcoxon-Mann-Whitney Critical values

Levene’s Test

Levene’s test is used to test the null hypothesis that multiple population variances (corresponding to multiple samples) are equal. Levene’s test determines whether a set of k samples have equal variances. Equal variances across samples are called homogeneity of variances. Some statistical tests, i.e. the analysis of variance, assume that variances are equal across groups or samples.  The Levene test can be used to verify that assumption. Levene’s test is an alternative to the Bartlett test. The Levene test is less sensitive
than the Bartlett test to depart from normality. If there is strong evidence that the data does in fact come from a normal, or approximately normal, distribution, then Barlett’s test has better performance. The well-known F test for the ratio between two sample variances assumes the data is normally distributed. Levene’s variance test is more robust against departures from normality. When there are just two sets of data, the Levene procedure is to:

  1. Determine the mean
  2. Calculate the deviation of each observation from the mean
  3. Let Z equal the square of the deviation from the mean
  4. Apply the t test of two means to the Z data

The methodology for this calculation is remarkably similar to that presented earlier for the 2 mean equal variance t-test. The sample sizes do not need to be equal for Levene’s test to apply.

Mood’s Median Test

Mood’s Median Test performs a hypothesis test of the equality of population medians in a one-way design. The test is robust against outliers and errors in data and is particularly appropriate in the preliminary stages of analysis. The median test determines whether k independent groups (equal size is not required) have either been drawn from the same population or from populations with equal medians. The first step is to find the combined median for all scores in the k groups. Next, replace each score by a plus if the score is larger than the combined median and by a minus, if it is smaller than the combined median. If any score falls at the combined median, the score may be assigned to the plus and minus groups by designating a plus to those scores which exceed the combined median and a minus to those which fall at the combined median or below. Next set up a chi-square “k x 2” table with the frequencies of pluses and minuses in each of the k groups.

1

Table I shows the counts of critical defects that occurred in 52 lots from six different styles. Table ll identifies and counts those scores above the combined median. The combined median i determined by pooling all of the Table I values and determining the middle value. In this case, the ordered 26th value is 3 and the 27th value is 4, so the median of all of the values is 3.5.

1
1

The (+0) is the number of observed cells with values greater than the median. The (-0) is the number of observed cells with values less than the median. The expected frequency (E) for each style for the number of lots above or below the median for that style, is one-half of the number of lots in that style or N/2.
There are 26 scores(+) above the combined median and 26 scores (- , not shown) below the combined median. To apply the chi-square test and to set up a chi-square table, the Table below shows the chi-square, k x 2 tables where (0) represents the observed frequencies and (E) represents the expected frequencies. Because cell expected frequencies (E) should not be less than 4 (preferably 5), the results of styles K and L are combined. The null hypothesis, Ho, states that all style medians are equal. The alternative hypothesis, H1, states that at least one style median is different. The chi-square calculation over all ten cells is represented by: The degrees of freedom for contingency tables is:
df= (rows – 1) x (columns – 1) = (2 – 1) x (5 – 1) = 4
Assume we want a level of significance (alpha) of 0.05. The critical chi-square:
χ20.05,4 = 9.49
Since the calculated χ2 is less than the critical χ2, the null hypothesis cannot be rejected, at a 0.05 level of significance (or a 95% confidence level).

Nonparametric Test Summary

For tests of population location, the following nonparametric tests are analogous to the parametric t-tests and analysis of variance procedures in that they are used to perform tests about population location or center value. The center value is the mean for parametric tests and the median for nonparametric tests

  1. One-sample sign performs a test of the median and calculates the
    corresponding point estimate and confidence interval. Use this test as a nonparametric alternative to the one-sample Z and one-sample t-tests.
  2. One-sample Wilcoxon performs a signed-rank test of the median and calculates the corresponding point estimate and confidence interval. Use this test as a nonparametric alternative to the one-sample Z and one-sample t-tests.
  3. Mann-Whitney performs a hypothesis test of the equality of two population medians and calculates the corresponding point estimate and confidence interval. Use this test as a nonparametric alternative to the two-sample t-test.
  4. Kruskal-Wallis performs a hypothesis test of the equality of population medians for a one-way design (two or more populations). This test is a generalization of the procedure used by the Mann-Whitney test and, like Mood’s median test, offers a nonparametric alternative to the one-way analysis of variance. The Kruskal-Wallis test looks for differences among the population medians.
  5. Mood’s median test performs a hypothesis test of the equality of population medians in a one-way design. Mood’s median test, like the Kruskal-Wallis test, provides a nonparametric alternative to the usual one-way analysis of variance. Mood’s median test is sometimes called a median test or sign scores test.

The Kruskal-Wallis test is more powerful (the confidence interval is narrower, on average) than Mood’s median test for analyzing data from many distributions, including data from the normal distribution, but is less robust against outliers.

1

Comparison Summary of Non Parametric test 

It should be noted that nonparametric tests are less powerful (they require more data to find the same size difference) than the equivalent t-tests or ANOVA tests. In general, nonparametric procedures are used either when parametric assumptions cannot be met, or when the nature of the data requires a nonparametric test.

Back to Home Page

If you need assistance or have any doubt and need to ask any questions contact us at preteshbiswas@gmail.com. You can also contribute to this discussion and we shall be happy to publish them. Your comment and suggestion are also welcome.

Multivariate analysis

In univariate statistics, there are one or more independent variables (X1, X2), and only one dependent variable (Y). Multivariate analysis is concerned with two or more dependent variables, Y1, Y2, being simultaneously considered for multiple independent variables, X1, X2, etc. The manual effort used to solve multivariate problems was an obstacle to its earlier use. Recent advances in computer software and hardware have made it possible to solve more problems using multivariate analysis. Some of the software programs available to solve multivariate problems include SPSS, S-Plus, SAS, and Minitab. This coverage of multivariate analysis can only be considered an introduction to the subject. For more in-depth information the reader is advised to consult other references.

Multivariate analysis has found wide usage in the social sciences, psychology, and educational fields. Applications for multivariate analysis can also be found in the engineering, technology, and scientific disciplines. This element will highlight the following multivariate concepts or techniques:

  • Multi-Vari Studies
  • Principal components analysis
  • Factor analysis
  • Discriminant function analysis.
  • Cluster analysis
  • Canonical correlation analysis
  • Multivariate analysis of variance

Multi-Vari Studies

Multi-Vari charts are practical graphical tools that illustrate how variation in the input variables (x’s) impacts the output variable (y) or response. These charts can help screen for possible sources of variation (x’s). There are two types of Multi-Vari studies: 1) Passive nested studies, which are conducted without disrupting the routine of the process, and 2) Manipulated crossed studies, which are conducted by intentionally manipulating levels of the x’s. Sources of variation can be either controllable and/or noise variables. Categorical x’s are very typical for Multi-Vari studies (i.e., short vs. long, low vs. high, batch A vs. batch B vs. batch C). Multi-Vari studies help the organization determine where its efforts should be focused on. Given either historic data or data collected from a constructed sampling plan, a Multi-Vari study is a visual comparison of the effects of each of the factors by displaying, for all factors, the means at each factor level. It is an efficient graphical tool that is useful in reducing the number of candidate factors that may be impacting a response (y) down to a practical number.

In statistical process control, one tracks variables like pressure, temperature, or pH by taking measurements at certain intervals. The underlying assumption is that the variables will have approximately one representative value when measured. Frequently, this is not the case. The temperature in the cross-section of a furnace will vary and the thickness of a part may also vary depending on where each measurement is taken. Often the variation is within the piece and the source of this variation is different from piece-to-piece and time-to-time variation. The multi-vari chart is a very useful tool for analyzing all three types of variation. Multi-Vari charts are used to investigate the stability or consistency of a process. The chart consists of a series of vertical lines, or other appropriate schematics, along a time scale. The length of each line or schematic shape represents the range of values found in each sample set. Variation within samples (five locations across the width) is shown by the line length. Variation from sample to sample is shown by the vertical positions of the lines.

To establish a multi-vari chart, a sample set is taken and plotted from the highest to lowest value. This variation may be represented by a vertical line or other rational schematics. The figure below shows an injection-molded plastic part. The thickness is measured at four points across the width as indicated by arrows.

Three hypothetical cases are presented to help understand the interpretation of multi-vari charts

Interpretation of the chart is apparent once the values are plotted.

The advantages of multi-vari charts are:

  1. It can dramatize the variation within the piece (positional).
  2. It can dramatize the variation from piece-to-piece (cyclical).
  3. It helps to track any time-related changes (temporal).
  4. It helps minimize variation by identifying areas to look for excessive variation. It also identifies areas not to look for excessive variation.

The table below identifies the typical areas of time and locational variation.

Note, positional variation can often be broken into multiple components:

Nested Designs

Sources of variation for a passive nested design might be:

  • Positional (i.e., within-piece variation).
  • Cyclical (i.e., consecutive piece-to-piece variation).
  • Temporal (time-to-time variation, i.e., shift-to shift or day-to-day).

The y-axis in this figure records the measure of performance of units taken at different periods of time, in a time-order sequence. Each cluster (shaded box) represents three consecutive parts, each measured in three locations. Each of the three charts represents a different process, with each process having the greatest source of variation coming from a different component. In the Positional Chart, each vertical line represents a part with the three dots recording three measurements taken on that part. The greatest variation is within the parts. In the Cyclical Chart, each cluster represents three consecutive parts. Here, the greatest variation is shown to be between consecutive parts. The third chart, the Temporal Chart, shows three clusters representing three different shifts or days, with the largest variation between the clusters.

Nested Multi-Vari Example:

In a nested Multi-Vari study, the positional readings taken were nested within a part. The positions within part were taken at random and were unique to that part; position 1 on part 1 was not the same as position 1 on part 2. The subgroups of three “consecutive parts” were nested within a shift or day. The parts inspected were unique to that shift or day. A sampling plan or hierarchy was created to define the parameters in obtaining samples for the study.

A passive nested study was conducted in which two consecutive parts (cyclical) were measured over three days (temporal). Each part was measured in three locations, which were randomly chosen on each part (positional). A nested Multi-Vari chart was then created to show the results.

The day-to-day variation appears to be the greatest source of variation, compared to the variation within part or part-to-part within a day (consecutive parts). The next step in this study would be to evaluate the process parameters that impact day-to-day variation i.e., what changes (different material lots/batches, environmental factors, etc.) are occurring day to day to affect the process.

Crossed Designs:

Sources of variation for a manipulated crossed design might be:

  • Machine (A or B).
  • Tool (standard or carbide).
  • Coolant (off or on).

Interactions can only be observed with crossed studies. When an interaction occurs, the factors associated with the interaction must be analyzed together to see the effect of one factor’s settings on the other factor’s settings. With fully crossed designs, the data may be reordered and a chart may be generated with the variables in different positions to clarify the analysis. In contrast, passive nested
designs are time-based analyses and therefore must maintain the data sequence in the Multi-Vari chart.

Crossed Design Example:

A sampling plan or hierarchy for a crossed design is shown below:

The coolant was turned “on” or “off” for each of two tools while the tools were being used on one of two machines. Every possible combination was run using the same two machines, the same two types of tools, and the same two coolant settings. The following chart uses these sources to investigate graphically the main effects and interactions of these factors in improving surface finish (lower is better).

It appears that the best (lowest) value occurs with carbide tools using no coolant. The different machines have a relatively small impact. It may also be noted that when the coolant is off, there is a large difference between the two tool types. Because of the crossed nature of this study, we would conclude that there is an interaction between coolant and tool type. The interaction is also apparent in this second chart, which shows the same data but different sorting. Coolant “off” and “carbide tool” is again the lowest combinations. Notice how coolant “on” is now the lowest combination with the standard tool. Hence, the interaction could also be expected here.

Steps to create a Multivariate chart:

Multi-Vari charts are easiest done with a computer, but not difficult to do by hand.

  1. Plan the Multi-Vari Study.
    • Identify the Y  to be studied.
    • Determine how they will be measured and validate the measuring system
    • Identify the potential sources of variation. For nested designs, the levels depend on passive data; for crossed designs, the levels are specifically selected for manipulation.
    • Create a balanced sampling plan or hierarchy of sources. Balance refers to equal numbers of samples within the upper levels in the hierarchy (i.e., two tools for each machine). A strict balance of exactly the same number of samples for each possible combination of factors, while desirable, is not an absolute requirement. However, there must be at least one data point for each possible combination.
    • Decide how to collect data in order to distinguish between the major sources of variation.
    • When doing a nested study, the order of the sampling plan should be maintained to preserve the hierarchy.
  2. Take data in the order of production (not randomly).
    • Continue to collect data until 80% of the typical range of the response variable is observed (low to high). (This range may be estimated from historical data.)
    • For fully crossed designs, a Multi-Vari study can be used to graphically look at interactions with factors that are not time-dependent (in which case, runs can be randomized as in a design of experiments).
  3. Take a representative sample.
    It is suggested that a minimum of three samples per lowest level subgroup be taken.
  4. Plot the data.
    • The y-axis will represent the scaled response variable.
    • Plot the positional component on a vertical line from low to high and plot the mean for each line (each piece). (Offsetting the bar at a slight angle from vertical can improve clarity.)
    • Repeat for each positional component on neighboring bars.
    • Connect the positional means of each bar to evaluate the cyclical component.
    • Plot the mean of all values for each cyclic group.
    • Connect cyclical means to evaluate the temporal component.
    • Compare components of variation for each component (largest change in y (Δy) for each component).
    • Many computer programs will not produce charts unless the designs are balanced or have at least one data point for each combination.
    • Each plotted point represents an average of the factor combination selected. When a different order of factors is selected, the data, while still the same, will be re-sorted. Remember, if the study is nested, the order of the hierarchy must be maintained from the top-down or bottom-up of the sampling plan.
  5.  Analyze the results.
    Ask Is there an area that shows the greatest source of variation? Are there cyclic or unexpected nonrandom patterns of variation? Are the nonrandom patterns restricted to a single sample or more? Are there areas of variation that can be eliminated (e.g., shift-to-shift variation)?

Example:
Several ribbons, one-half short and one-half long and in four colours (red, white, blue, and yellow), are studied. Three samples of each combination are taken, for a total of twenty-four data points (2 x 4 x 3). Ribbons are nested within the “length”: ribbon one is unique to “short” and ribbon four is unique to “long.” Length, however, is crossed with colour: “short” is not unique to “blue.” Length is repeated for all colours. (This example is a combination study, nested and crossed, as are many Gauge R&Rs.)

The following data set was collected. Note that there are three ribbons for each combination of length and colour as identified in the “Ribbon #” column.

The ribbons are sorted by length, then colour to get one chart.

  • Each observation is shown in coded circles.
  • The squares are averages within a given length and colour.
  • Each large diamond is the average of six ribbons of both lengths within a colour.
  • Note the obvious pattern of the first, second, and third measured ribbons within the subgroups. The short ribbons (length = 1) consistently measure low, while the long ribbons consistently measure high, and the difference between short and long ribbons (Δy) is consistent.
  • There is more variation between colours than lengths (Δy is greater between colours than between lengths).
  • Also note the graph indicates that while the value of a ribbon is based upon both its colour and length, longer (length = 2) ribbons are in general more valuable than short ribbons. However, a short red ribbon has a higher value than a long yellow one. Caution should be taken here because not much about how the individual values vary relative to this chart is known. Other tools (e.g., hypothesis tests and DOEs) are needed for that type of analysis.

Multi-Vari Case Study

A manufacturer produced flat sheets of aluminium on a hot rolling mill. Although a finish trimming operation followed, the basic aluminium plate thickness was established during the rolling operation. The thickness specification was 0.245″ ± 0.005″. The operation had been producing scrap. A process capability study indicated that the process spread was 0.0125″ (a Cp of 0.8) versus the requirement of 0.010″. The operation generated a profit of approximately  Rs 20,00,000 per month even after a scrap loss of Rs,2,00,000 per month. Refitting the mill with a more modern design, featuring automatic gauge control and hydraulic roll bending, would cost Rs 80,00,000 and result in 6 weeks of downtime for installation. The department manager requested that a multi-vari study be conducted by a quality engineer before further consideration of the new mill design or other alternatives. Four positional measurements were made at the corners of each flat sheet in order to adequately determine within-piece variation. Three flat sheets were measured in consecutive order to determine piece-to-piece variation. Additionally, samples were collected each hour to determine temporal variation. The pictorial results are as follows The maximum detected variation was 0.010″. Without sophisticated analysis, it appeared that the time-to-time variation was the largest culprit. A gross change was noted after the 10:00 AM break. During this time, the roll coolant tank was refilled.
Actions taken over the next two weeks included re-leveling the bottom back-up roll (approximately 30% of total variation) and initiating more frequent coolant tank additions, followed by an automatic coolant make-up modification (50% of total variation). Additional spray nozzles were added to the roll stripper housings to reduce heat build-up in the work rolls during the rolling process (10%-15% of total variation). The piece-to-piece variation was ignored. This dimensional variation may have resulted from roll bearing play or variation in incoming aluminum sheet temperature (or a number of other sources). The results from this single study indicated, if all of the modifications were perfect, the resulting measurement spread would be 0.002″ total. in reality, the end result was  0.002″ or 0.004″ total, under conditions similar to that of the initial study. The total cash expenditure was Rs 80,000 for the described modifications. All work was completed in two weeks. The specification of 0.245″ ± 0.005″ was easily met.

Principal Components Analysis

Principal components analysis (PCA) and factor analysis (FA) are two related techniques used to find patterns of correlation among many possible variables or subsets of data and to reduce them to a smaller manageable number of components or factors. The researcher attempts to find the primary components, or factors, that account for most of the sources of variance. PCA refers to subsets as components and FA uses the term factors. Grimm states that a minimum of 100  observations should be used for PCA. The ratio is usually set at approximately 5 observations per variable. If there are 25 variables, then the ratio of 5:1 requires 5 observations/variable x 25 variables = 125 observations.

For illustration purposes, five independent variables will be considered in the growth of communities. The investigator wants to know how many of these components really contribute to growth: one, two, three, or all?  Perhaps two principal components will explain 95% of the variance. The other three may only contribute 5%. At one time, multivariate analysis required familiarity with linear algebra and matrices. To reduce this manual effort, a statistical software package such as Minitab, SPSS, or S-Plus can be used. Minitab is used in this discussion to display variances and the correlation matrix. Higher correlation values indicate a key linkage of the factors. An example of PCA is presented below in the table below. In this example, an investigator wishes to uncover the principal factors that are important for a community desiring high-tech growth. If there are only a few principal factors accounting for the vast majority of the variance in growth, then communities can focus on these vital few. The independent factors are:

  • High tech workers (thousands of workers)
  • Entrepreneurial culture (number of startups per year)
  •  University-industry interactions (measured by projects per year)
  • Creative classes (percentage of professionals and knowledge workers)
  •  Amount of venture capital (in millions of dollars)

The table below shows hypothetical data generated from interviews with community leaders.

For illustration purposes, the Minitab statistical recap of the information is shown in the table below. It provides the correlation matrix. A step-by-step analysis of the Minitab results are as follows:

  • A correlation matrix is used to determine the relationship between components.
  • Matrices define quantities as eigenvalues and eigenvectors. This is an eigenvalue analysis.
  • The eigenvalues are summed and a proportion is calculated. The sum of eigenvalues is 4.9999 (5.0 due to rounding errors). Thus, 3.5856 divided by 4.9999 is 0.717. PC1 contains 71.7% of the variance.
  • PC1 and PC2 explain 89.2% of the variance. This may be sufficient for the researcher.
  • There are five total components. Pareto analysis indicates two principal components.
  •  The first PC indicates that there is no clear separation for four components (high tech workers, entrepreneurial culture, university-industry projects, and venture capital). It is up to the researcher to further distinguish this grouping. It could be more related to the need for a critical mass of necessary resources The second PC indicates that “creative class” is the prime component.  A closer look at the first principal component may be required since the values are negative. (This was a small illustrative sample.)
  •  A “scree” plot (similar to a Pareto line chart) is provided by Minitab software to display the “vital few” eigenvalues.

Finally, an equation can be generated for the two principal components via the use of the coefficients.

PC1 = -O.449 (hightec) -O.507 (entre) -0.512 (university)  -0.226 (creative) – 0.478 (venture)
PC2 = 0.154 (hightec) +0.189 (entre) +O.80 (university) -O.966 (creative) -0.025 (venture)

Factor Analysis

Factor analysis is a data reduction technique to identify factors that explain variation. It is very similar to the principal components analysis technique. That is factor analysis attempts to simplify complex sets of data, reducing many factors to a smaller set. However, there is some subjective judgment involved in describing the factors in this method of analysis. The output variables are linearly related to the input factors. The variables under investigation should be measurable, have a range, of measurements, and be symmetrically distributed. There should be four or more input factors for each dependent variable. Factor analysis undergoes two stages: factor extraction and factor rotation. The first analysis will distinguish the major factors for further study (extraction). The second stage will rotate the factors, to make them more meaningful. A principal components analysis can be performed on the data to provide a reduction in the number of factors. ( Minitab can also examine the data through a “maximum likelihood” method.) The economic development data from the previous example was channeled through a principal components analysis which indicated that two factors were significant. From this information, a researcher can go back into Minitab, perform a factor analysis for two factors and obtain a correlation matrix. To make sense of the information, note that Factor 1 has the four factors in a grouping (enterprise, university, high tech, and venture) and Factor 2 has the creative class as the prime factor. This is a similar result to the earlier principal components analysis. Again, the first factor has negative readings, so the researcher should examine that grouping more closely for meaning. The communality column indicates whether the chosen variables explain the variability fit very well. The communality numbers are very high. This means that the researcher can state that the two major factors in high technology community development would involve the five studied variables. The data and factors can be rotated (by the software) to view the data from a different perspective. The four rotational methods in Minitab are equimax, varimax, quartimax, and orthomax. Other software has other varieties.

Discriminant Analysis

If one has a sample with known groups, discriminant analysis can be used to classify the observations or attributes into two or more groups. Discriminant analysis can be used as either a predictive or a descriptive tool. The decisions could involve medical care, college success attributes, car loan creditworthiness, or previous economic development issues. Discriminant analysis can be used as a follow-up to the use of MANOVA. The possible number of linear combinations (discriminant functions) for a study would be the smaller of the number of groups -1, or the number of variables. Some assumptions in the discriminant analysis are: the variables are multivariate, normally distributed, the population variances and covariances among the dependent variables are the same, and the samples within the variables are randomly obtained and exhibit independence of scores from the other samples. Minitab provides two forms of analysis: a linear and quadratic discriminant analysis. The linear discriminant analysis assumes that all groups have the same covariance matrix. This is not the case for the quadratic case. In the linear discriminant analysis, the Mahalanobis distance is the measure used to form or classify groups. The Mahalanobis distance is the squared distance (linear measure) from the observation to the group center. The classification into groups is formed by the distance measure. In the quadratic discriminant analysis, the squared distance does not translate to a linear function, but into a quadratic function. The quadratic distance is called the generalized squared distance.
The previous example, which provided information on high technology growth, will be used for a discriminant analysis example. An additional column has been inserted. It is a column used to state that the area is a “new economy” community. For example, a “yes” or “no” will be used to indicate if a community is considered a “new economy” area. The discriminant analysis will correlate the data and verify if the decision was correct.

The Minitab analysis states that the decisions on the grouping were 10 out of 10 (100% correct). That is, the values in the various factors match up enough to place various regions in certain categories.

Discriminant Analysis: New economy versus creative class, entrepreneurial culture, University-industry projects and venture capital.
Linear Method for Response: New Economy Predictors such as  creative, entrepre, universi, high tech venture

Summary of Classification:  N = 10     N Correct = 10       Proportion Correct = 1.000 (100%)

Squared distance between groups
(also called the Mahalanobis distance):

 noyes
No0.000009.17913
yes9.179130.00000

Linear Discriminant Function for Group:

The above results are Minitab outputs with few adjustments.

Cluster Analysis

Cluster analysis is used to determine groupings or classifications for a set of data. A variety of rules or algorithms have been developed to assist in group formations. The natural groupings should have observations classified so that similar types are placed together. A file on attributes of high achieving students could be grouped or classified by IQ, parental support, school system, study habits, and available resources. Cluster analysis is used as a data reduction method in an attempt to make sense of large amounts of data from surveys, questionnaires, polls, test questions, scores, etc.
The economic development example in the previous discussion will again be used to validate groupings. The two types of groups will be the new economy and not the new economy. The graphic output from the analysis is the classification tree or dendogram. It is a graphic line graph linking variables and groups at various stages.
The Table data will be analyzed by the cluster analysis method. Using Minitab, the first analysis request calls for two groups. (More groups can be used.) It is displayed below. The analysis shows our requested two groupings. However, instead of grouping into our presumed two groups of new economy or not the new economy, the program used an algorithm based on measures of “closeness” between groups. Since the author requested two groups, the final iteration provides two groups. The dendogram in the Figure below provides a visual that San Jose is distinctive and of a higher ranking than the other communities. The dendogram shows that Austin and Seattle are also distinct from the other lower communities. Communities 7, 8, and 9 forms the lowest cluster. This result can be verified by rerunning the analysis and requesting four groupings. Another interesting analysis would be to group the data by the original five factors as shown above Figure indicates that creative class is separated from the other factors in the grouping. In the principal components and factor analysis discussion, creative class was always the major factor listed in the second group, separated from the other four factors. Similar results can be obtained using different multivariate tools.

Canonical Correlation Analysis

Canonical analysis tests the hypothesis that effects can have multiple causes and causes can have multiple effects. This technique was developed by Hotelling in 1935 but was not widely used for over 50 years. The emergence of personal computers and statistical software has led to its fairly recent adoption. Canonical correlation analysis is a form of multiple regression to find the correlation between two sets of linear combinations. Each set may contain several related variables. The relating of one set of independent variables to one set of dependent variables will form linear combinations. The largest correlation values for sets are used in the analysis. The pairings of linear combinations are called canonical variates, and the correlations are called canonical correlations (also called characteristic roots). There may be more than one pair of linear combinations that could be applicable for an investigation. The maximum number of linear combinations would be limited by the number of variables in the smaller set. Most involve only two sets.  The canonical correlation coefficient, rc, is similar to the Pearson product-moment correlation coefficient. The rule of thumb is to have values above 0.30. The squared value would represent less than 10% in overlapping variance between pairs of canonical variates. The linear combinations can be determined from linear matrix algebra or statistical software. For instance, SPSS software can test for significance of canonical correlation and will provide several additional tests.
The table below illustrates the correlation of sets of independent variables to sets of dependent variables. An industrial survey can be conducted to see if there is a correlation between the characteristics of a quality engineer to the listed job skills of a quality engineer. There may be a set of variables that are strongly correlated and canonical correlation can be used.

Hotelling’s T2 test is a t-test that is used on more than 2 variables at a time. The student t-test can also be used to compare 2 samples at a time, but if it is used to compare 5 samples, 2 at a time, the probability of obtaining a type one error is increased. That is, finding a significant difference when the two samples are the same. If a 5% error is used, the probability of obtaining such an error is 1 – 0.952p.
Where p is the number of samples. Hotelling’s T2 is the preferred and recommended test method.

MANOVA (Multiple Analysis of Variance)

An analysis of variance is used for many independent X variables to solve one dependent Y variable. This method tests whether the mean differences among groups on a single dependent Y variable is significant. For multiple independent X variables and multiple dependent Y factors, (that is, two or more Ys and one or more Xs), the multiple analysis of variance is used. MANOVA tests whether mean differences among groups of a combination of Ys are significant or not. The concept of various treatment levels and associated factors are still valid. The data should be normality distributed, have homogeneity of the covariance matrices, and have the independence of observations. ln ANOVA, a sum of squares is used for the treatments and for the error term. In MANOVA the terms become matrices of the “sum of squares and cross-products”(SSPCP). ANOVAs used multiple times across the dependent variables could result in inflated alpha errors. The MANOVA method is used to reduce the alpha risk by having only one test.

MANOVA Example

In an engineered plastics company, a multivariate experiment test was conducted having two independent variables (time and pressure of the extrusion process) at two levels, and three dependent responses (tensile strength, coefficient of friction, and bubble breaks). A MANOVA was conducted to test for relationships. The levels for the independent variables:
Time: high (+) equals 30 seconds, low (-) equals 10 seconds
Pressure: high (+) equals 80 psi, low (-) equals 20 psi

The shortened Minitab output for the MANOVA is presented in the table below. It only has three statistics tables for the responses and interactions. Minitab automatically inserts the four statistical tests (Wilks’, Lawley-Hotelling, Roy’s, and Pillai-Bartlett) and makes the analysis. The results indicate that both the factors, time and pressure are significant with p values much below 5%. The interaction of time x pressure is not significant. For simplicity, the extensive SSCP tables were not displayed. For the individual familiar with linear algebra and matrices, the manual y calculations can also be made.


Back to Home Page

If you need assistance or have any doubt and need to ask any questions contact us at preteshbiswas@gmail.com. You can also contribute to this discussion and we shall be happy to publish them. Your comment and suggestion are also welcome.